
TERRAEarth observation · open source · v0.7.0
Read the groundfrom orbit.
TERRA studies an area on your own machine: what covers it, where water reaches, how the terrain lies, what sun and wind it receives. It reports where those answers are uncertain, rather than only how much of them is right.
- Sensor
- Sentinel-2 L2A
- Bands read
- 6 of 13
- Revisit
- 5 days
- Scale
- Farm → landscape
- Runs
- Locally · no account
01Mission
A research instrument, not a GIS
TERRA is built for the detailed study of particular areas, at farm to landscape scale, under a fixed protocol.
It does not set out to cover the ground that Earth Engine or QGIS already cover. It packages a published classification method into a desktop application, reads imagery on demand, and keeps every run on your own machine.
Mission overview →- 01
Local
No account and no server. Imagery is read on demand, and every run stays on your disk.
- 02
Windowed
Only the polygon and the bands it needs are read from Cloud-Optimized GeoTIFFs. No full scene is downloaded.
- 03
Published
The default classifier reproduces a method published at SBrT 2026.
- 04
Accountable
Every map is checked against a reference, and the disagreement is shown where it happens.
02Products
Nine products,
one area
Everything TERRA produces is computed over the same polygon: first the land cover and its verification, then the products that read the same ground.
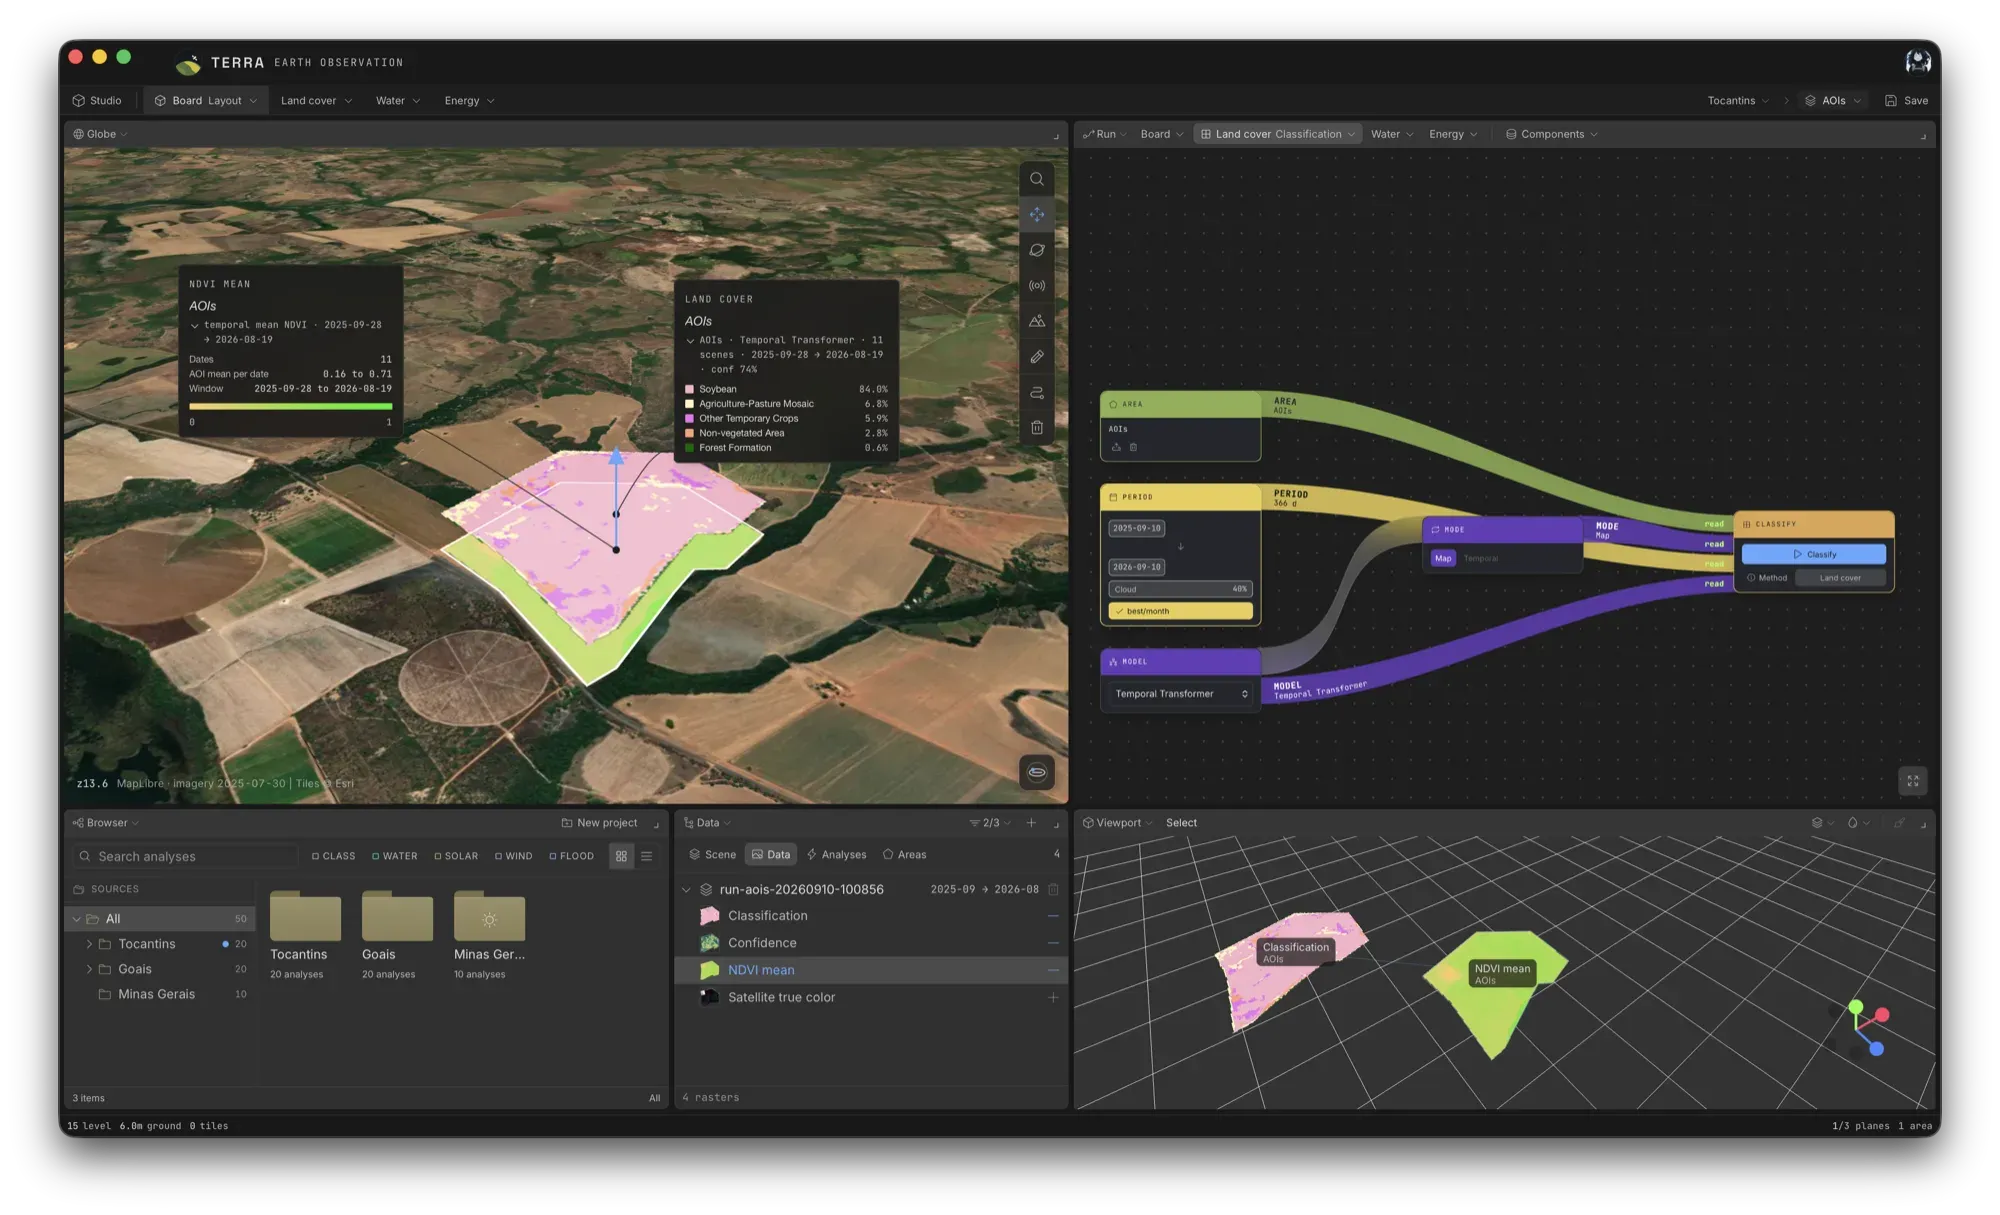
Land cover
Five MapBiomas classes from a season of Sentinel-2 scenes, with a confidence value for every pixel.
Product sheet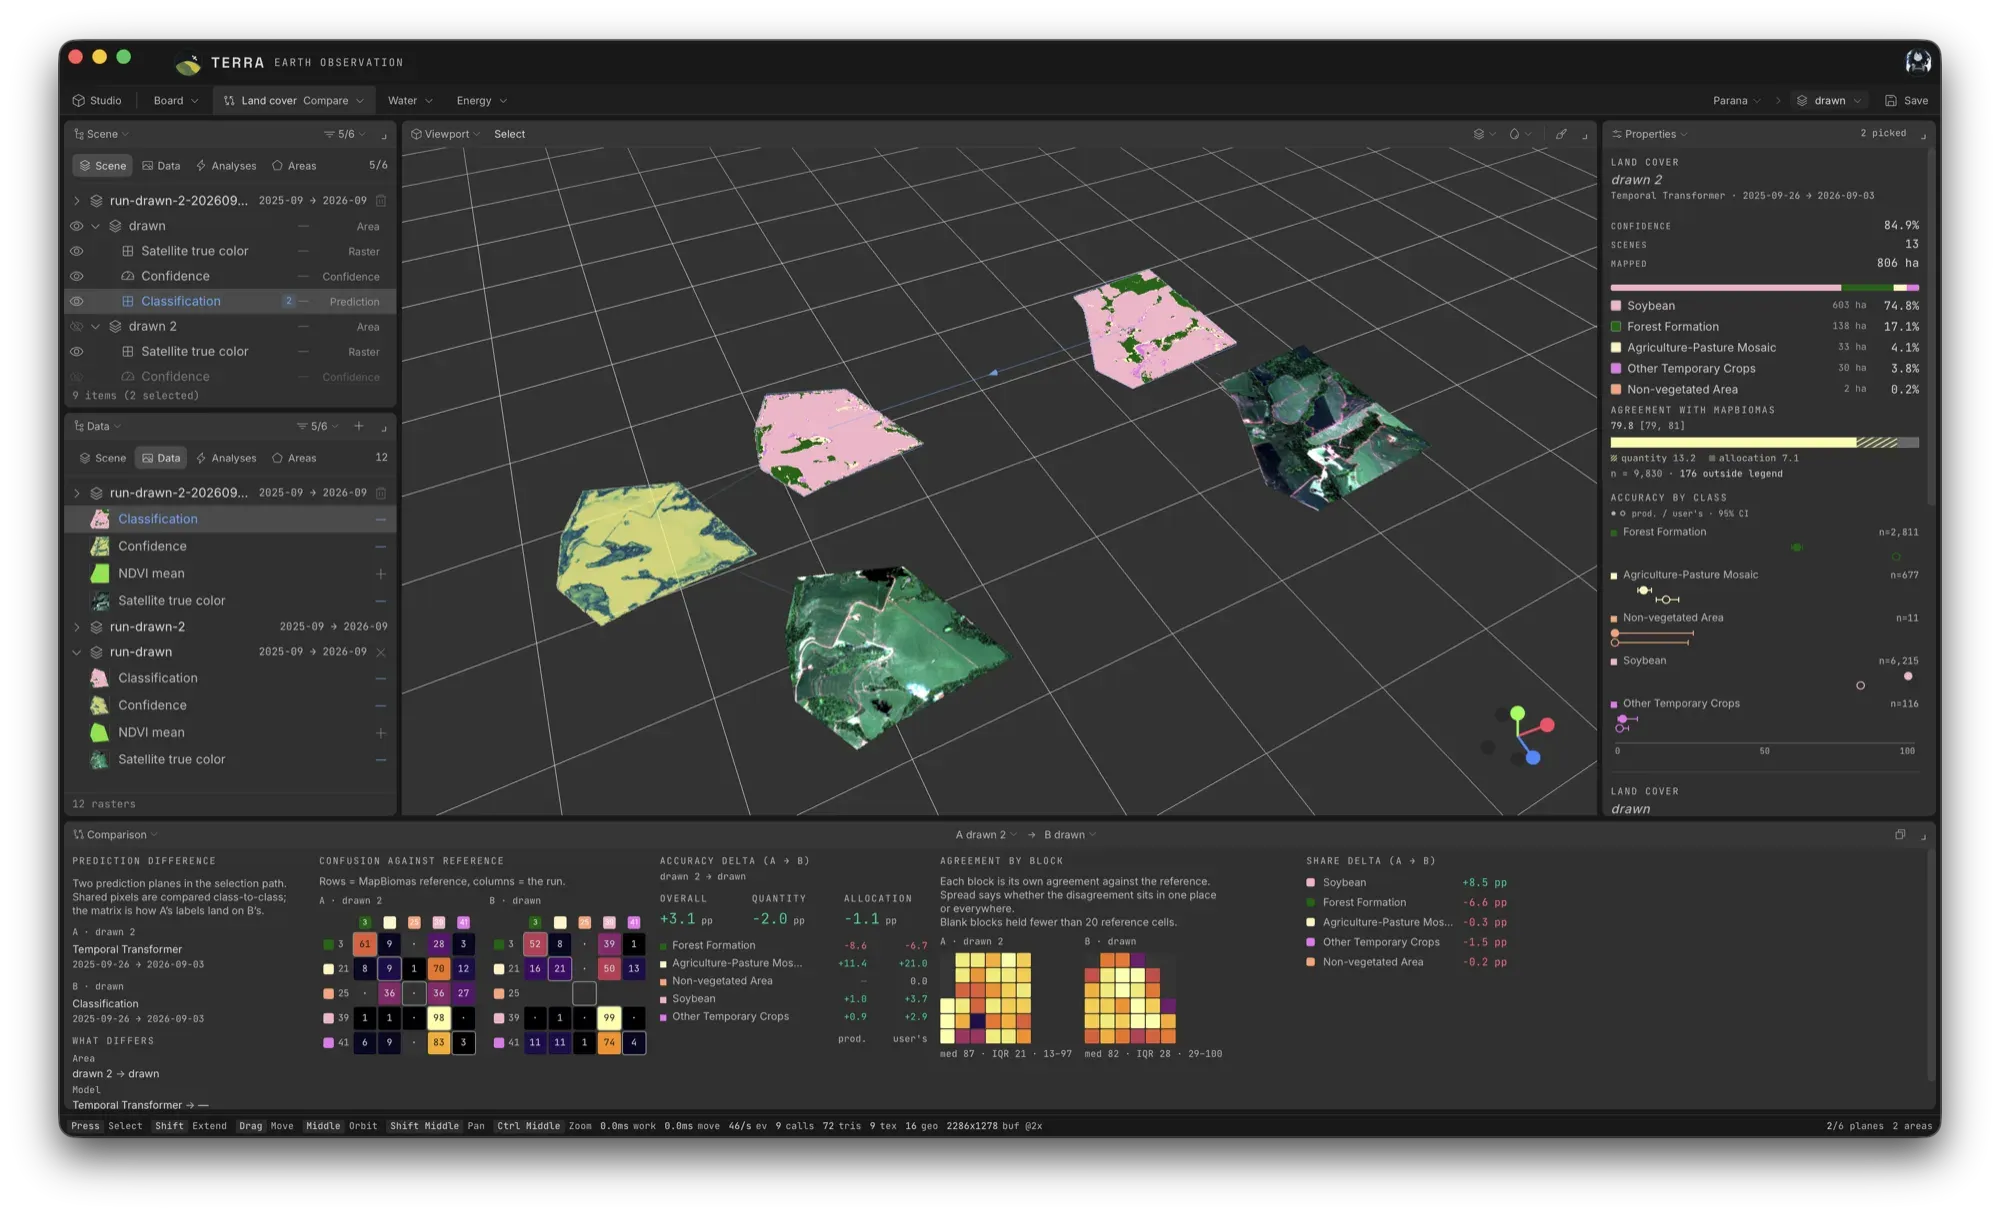
Compare
How the models perform across areas of interest in different regions, whether in the same state or in different ones.
Product sheet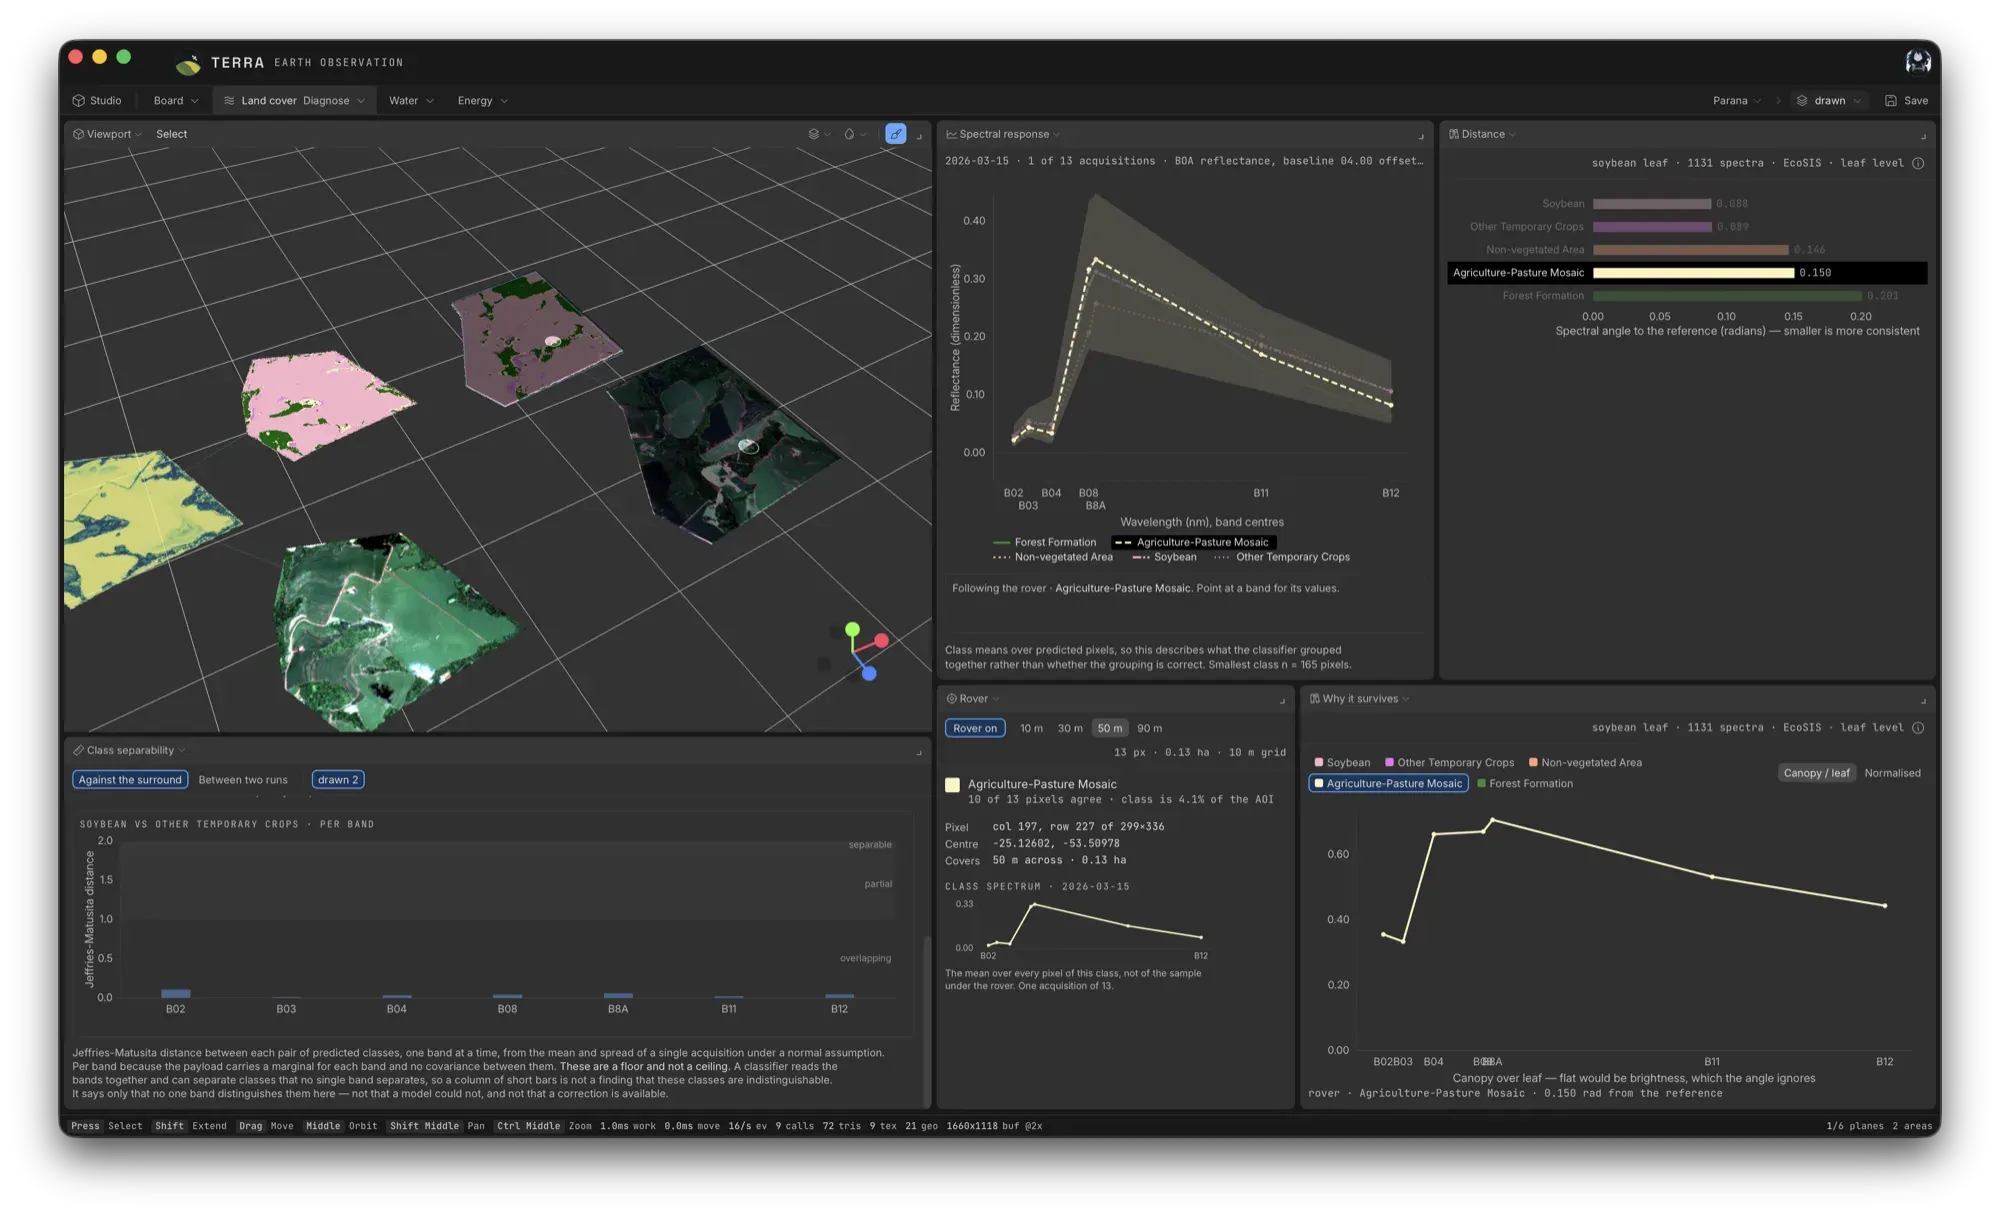
Diagnose
Domain shift between areas, and a detailed analysis of the spectral response of each predicted class.
Product sheet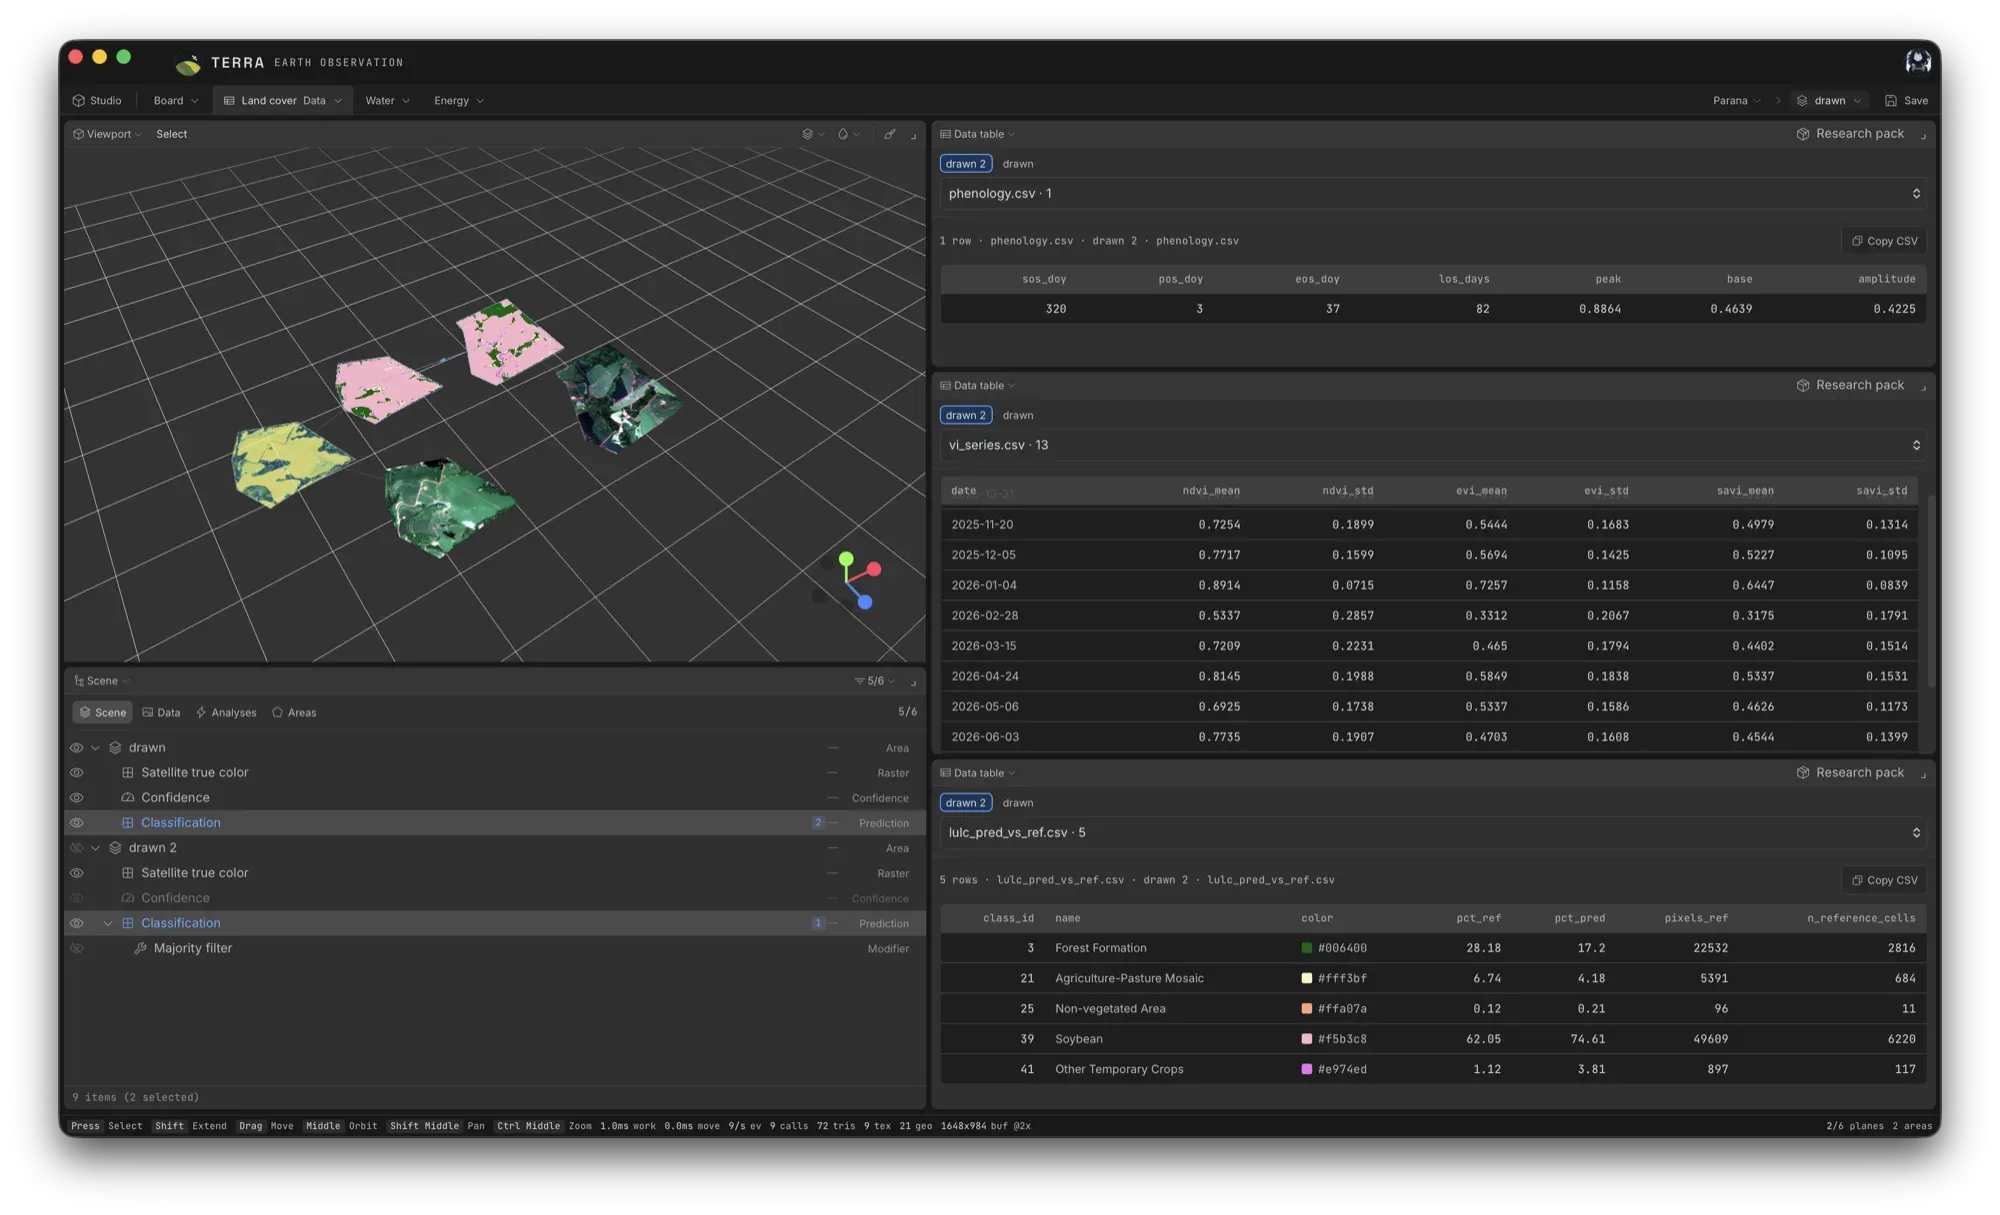
Data and research pack
The run's tables (phenology, vegetation-index series, prediction against the reference), read in the studio and exported as a research pack.
Product sheet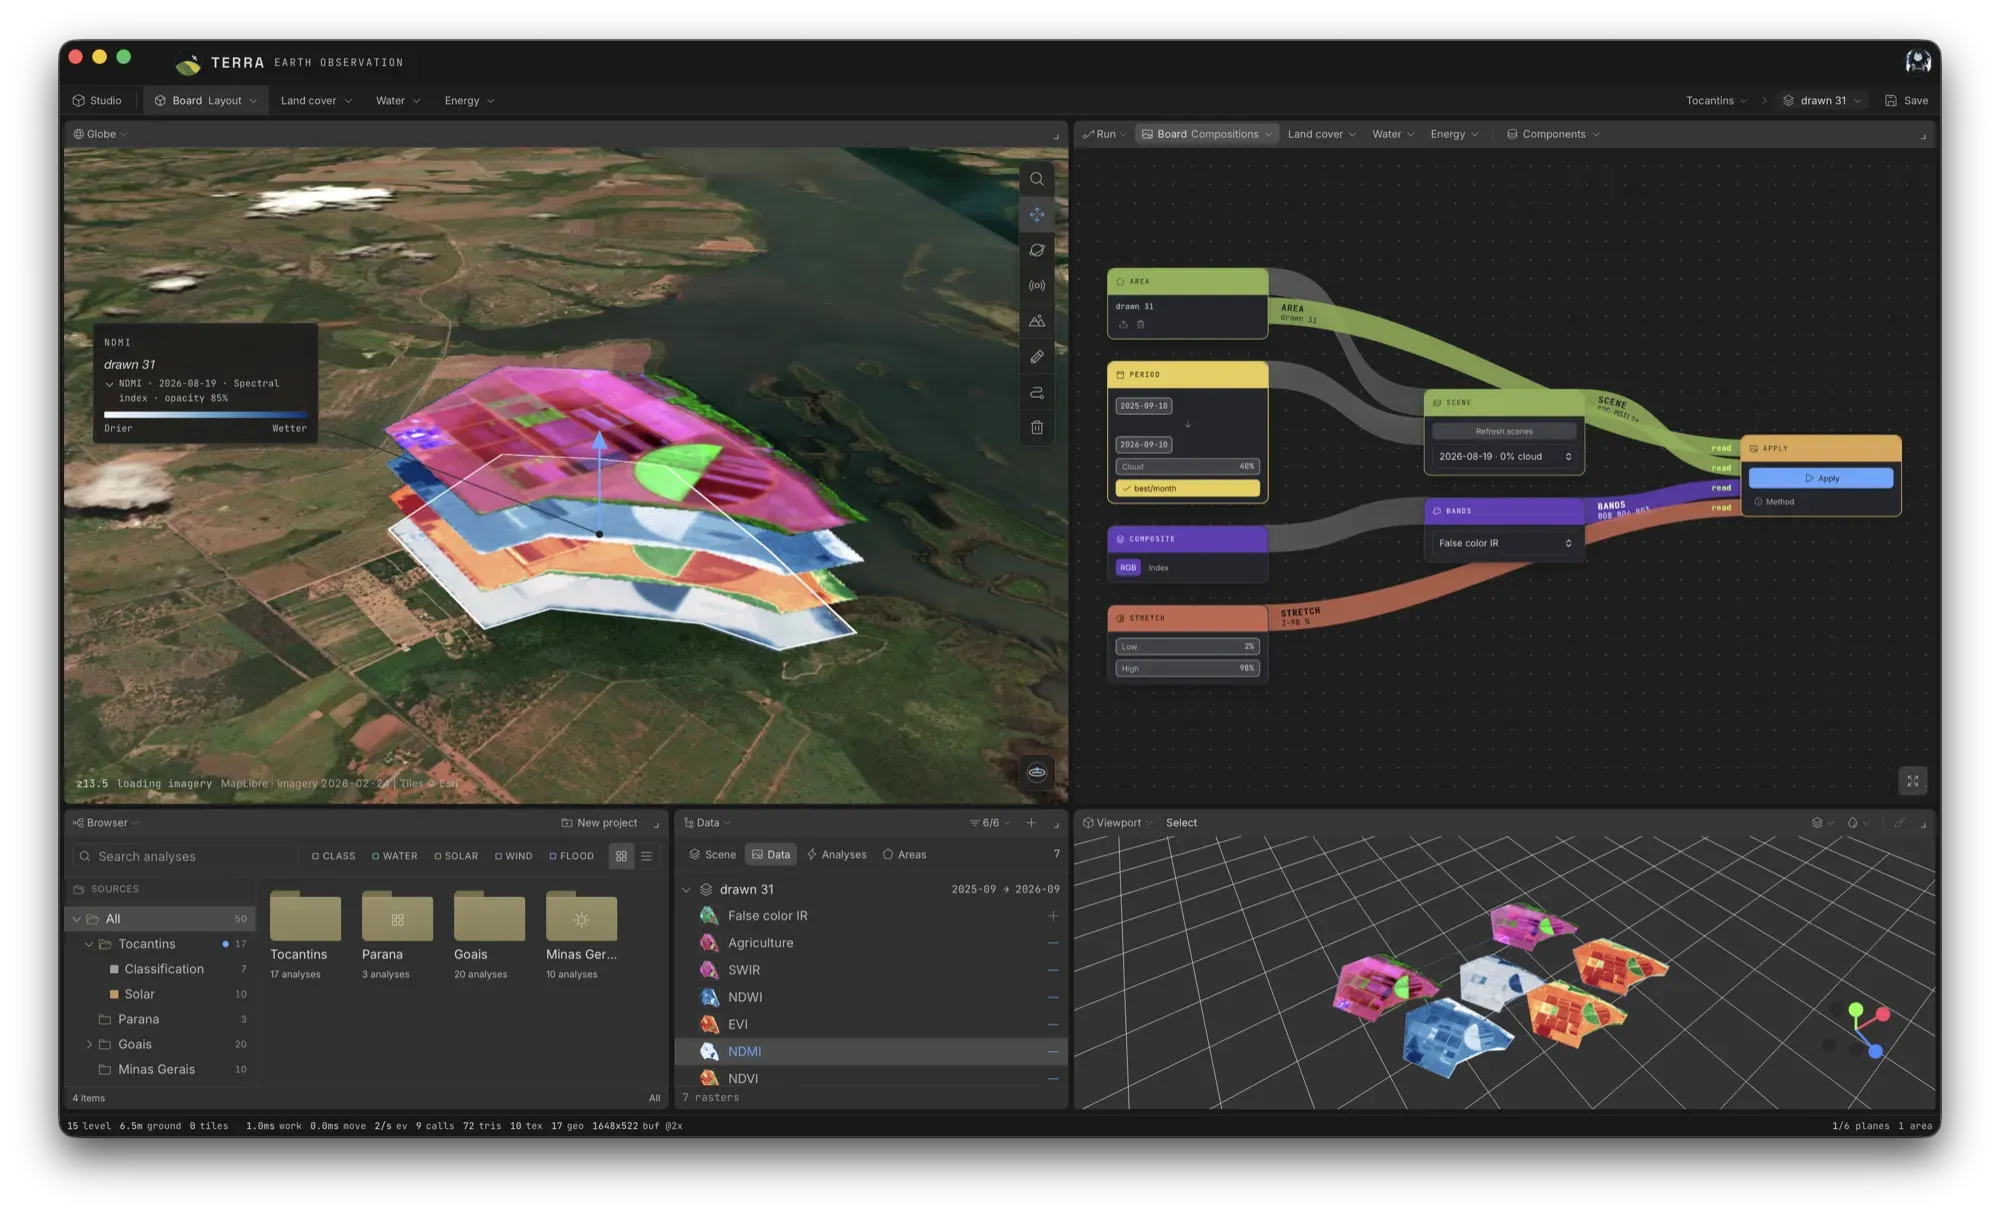
Band compositions
True colour, false-colour infrared, agriculture and SWIR composites, or a spectral index, from any scene in the window.
Product sheet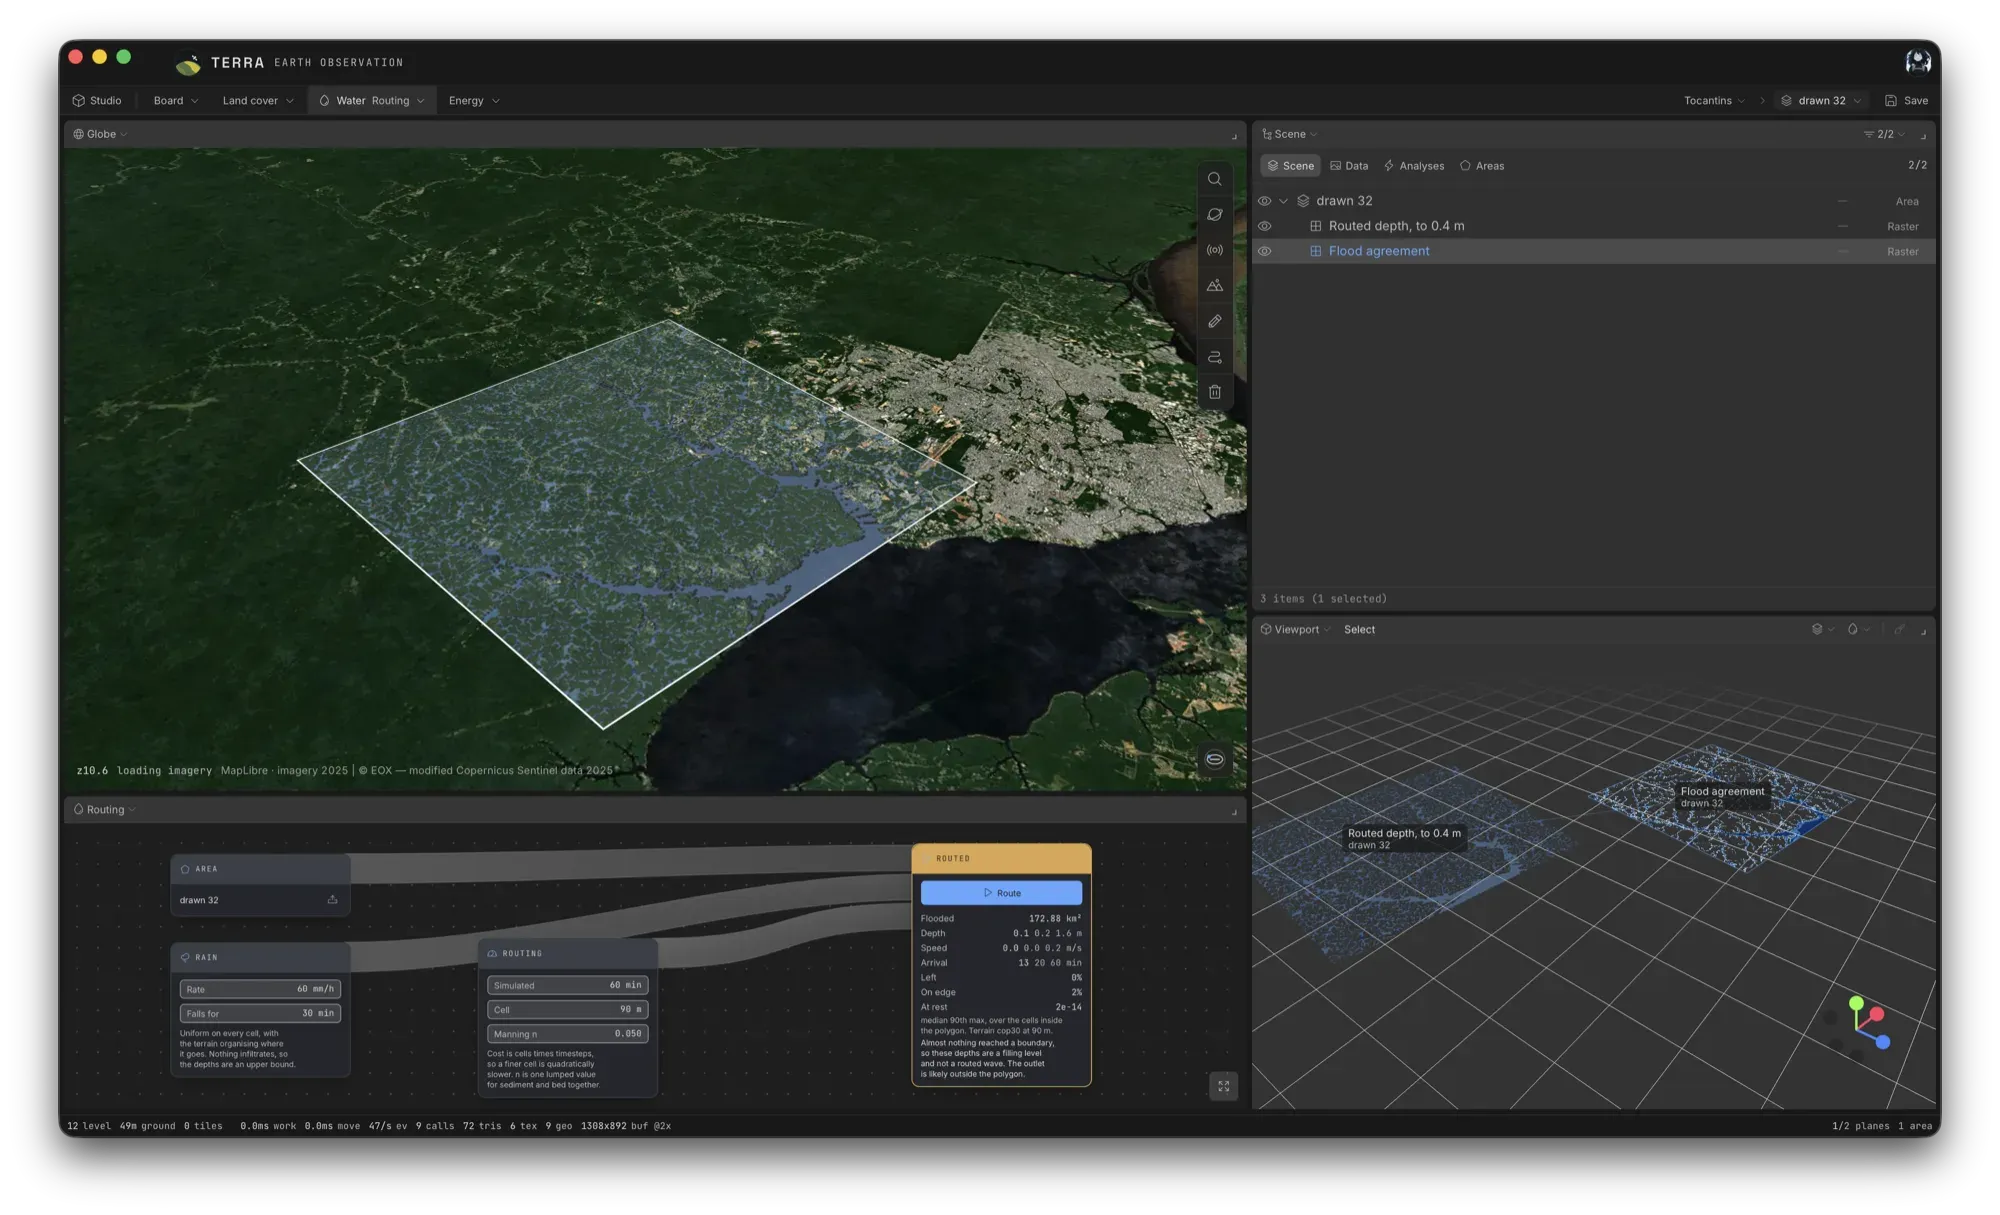
Water routing
Rain put on every cell and routed over the terrain: where it goes, how deep, how fast and when it arrives.
Product sheet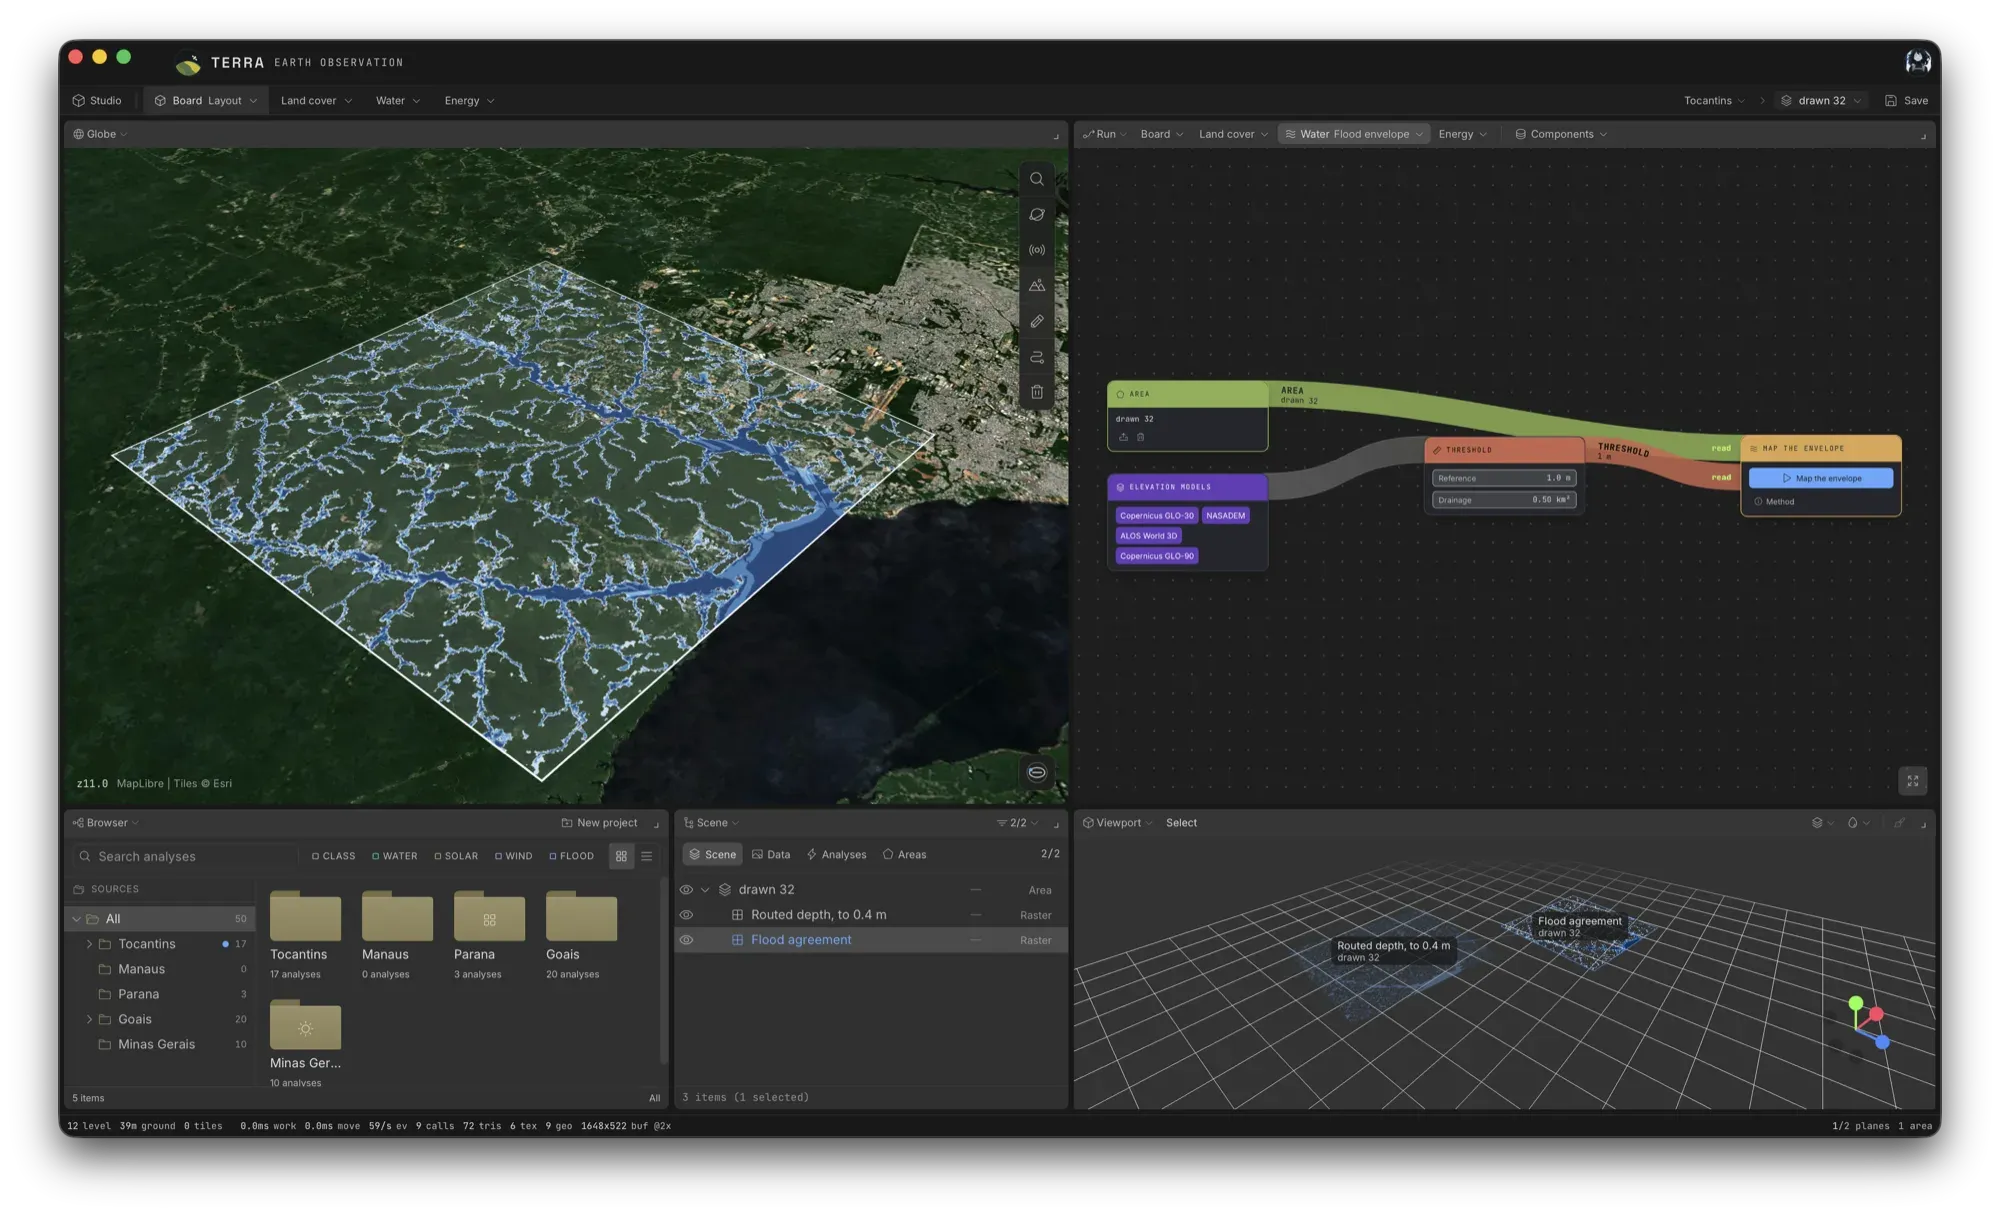
Flood envelope
Height above the nearest drainage, measured on four elevation models, with the agreement between them drawn on the map.
Product sheet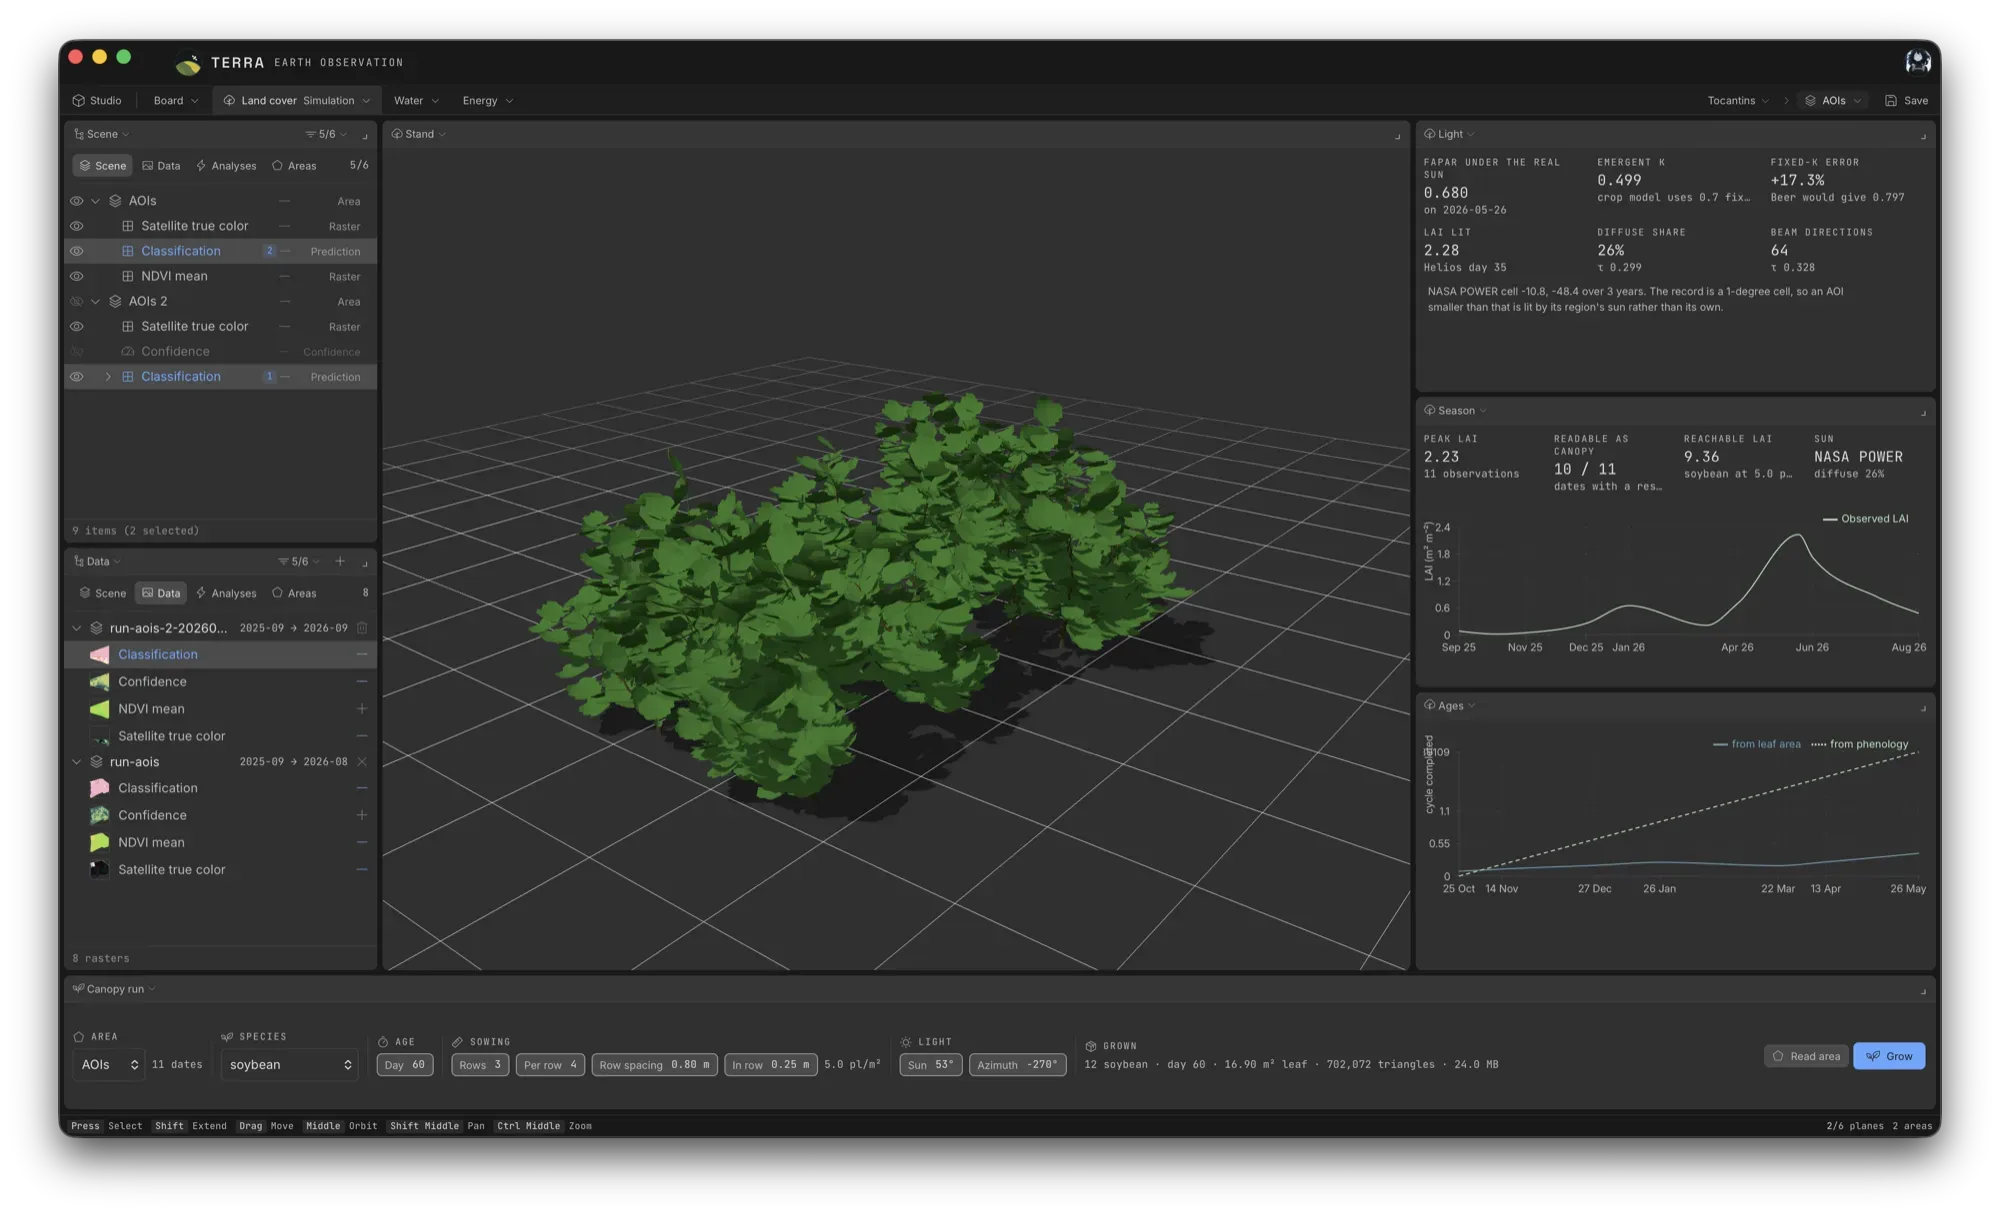
Canopy simulation
A crop stand grown from what the satellite measured and lit by its own sky. The reading at the end is the fraction of light it intercepts.
Product sheet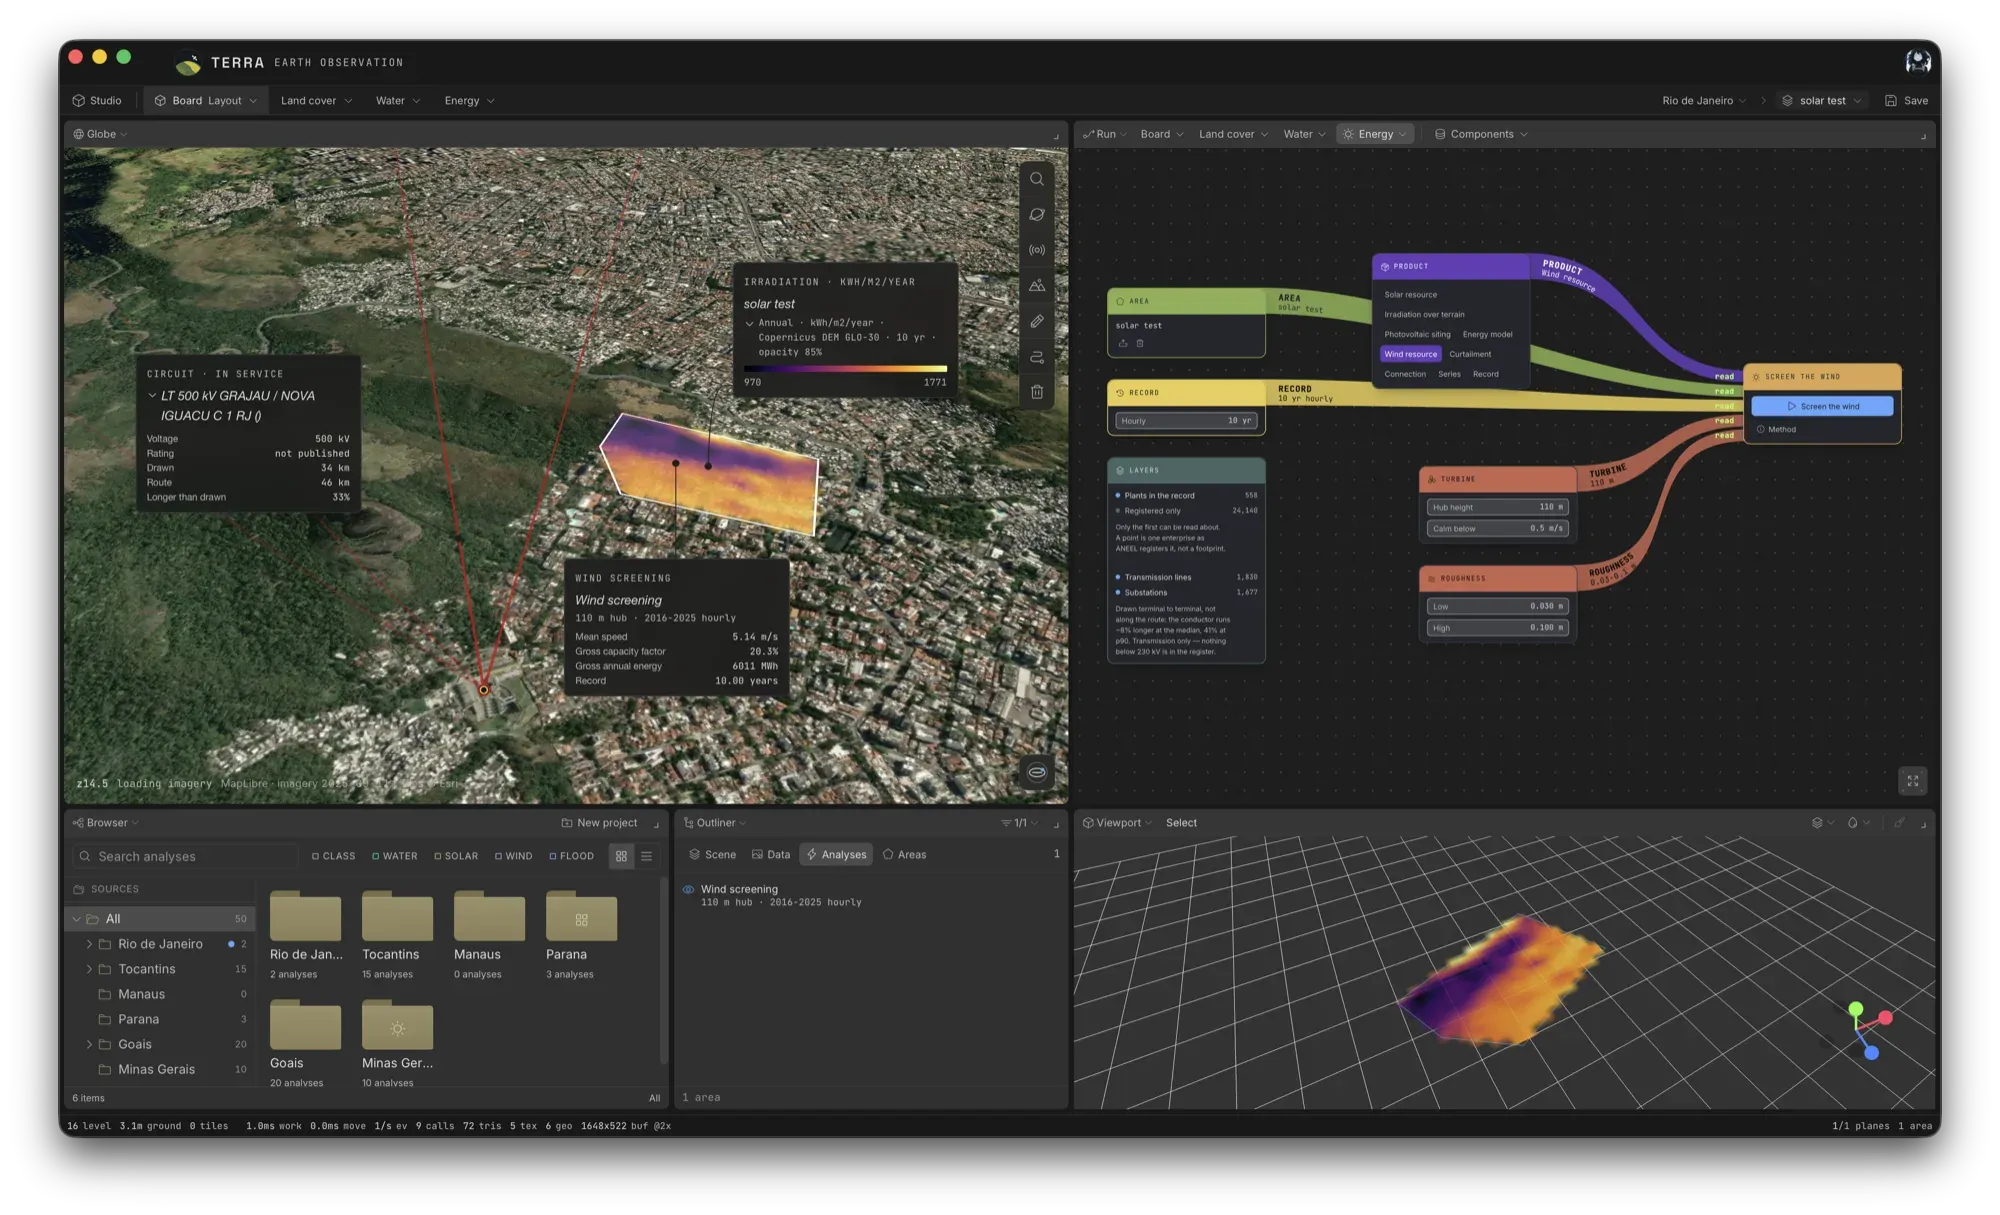
Solar and wind
Solar resource, PV siting and yield, wind screening, and what the electrical grid does to a plant. A screening step, not a siting study.
Product sheetThe full payload
Inputs, methods, outputs and caveats for every product, on one page each.
All products03Data chain
From orbit
to answer
Seven stages lie between a polygon and a verified map, and at no point is more read than the area needs.
Stage 01 / 07
Area of interest
Draw a polygon on the map or the globe, search for a place, or import a file. The scale is deliberate: a farm, a watershed, a landscape. Not a continent.
- In
- Polygon, drawn or imported
- Out
- AOI geometry
Stage 02 / 07
Catalog query
Sentinel-2 Level-2A acquisitions over the area are found in the Microsoft Planetary Computer STAC catalog. They are filtered by cloud cover, and optionally only the best scene of each month is kept.
- In
- AOI · window · max cloud %
- Out
- Scene list
Stage 03 / 07
Windowed read
Only the polygon's window and the bands the model needs are read, straight from Cloud-Optimized GeoTIFFs. No full Sentinel-2 product is ever downloaded. The 20 m bands are clipped onto the 10 m B04 grid.
- 10 m
- B02 · B03 · B04
- 20 m
- B8A · B11 · B12
Stage 04 / 07
Features
The default model reads 80 features per pixel: band statistics, NDVI, EVI and SAVI temporal descriptors, and 22 raw NDVI dates. The Temporal Transformer reads the band sequence itself. Prithvi-EO 2.0 reads frozen embeddings.
- In
- Band stack × dates
- Out
- Feature matrix or embeddings
Stage 05 / 07
Classification
A Random Forest of 300 trees at depth 20, or one of two alternative model paths, assigns every pixel to one of five MapBiomas classes and records how confident it was.
- Out
- Class overlay · confidence · GeoTIFF
- With
- VI series · phenology · LULC
Stage 06 / 07
Verification
The map is checked cell by cell against MapBiomas. Producer's and user's accuracy come per class with Wilson intervals, quantity and allocation error are reported apart, and agreement is broken into spatial blocks.
- Ref
- MapBiomas Collection 10 · 2023
- Out
- Where the map is wrong
Stage 07 / 07
Run archive
The Go shell keeps the run on your machine. It can be reopened later, compared with another area or another season, and arranged on a studio board.
- Store
- SQLite · local disk
- Next
- Studio · Compare · Diagnose
03.1Spectral payload
Six of thirteen bands
- B02Blue
- B03Green
- B04Red · reference grid
- B8ANarrow near-infrared
- B11Shortwave infrared 1
- B12Shortwave infrared 2
04Validation
Measured against a published method
Overall accuracy
Cohen's κ
The spectral Random Forest reproduces the method of the SBrT 2026 paper. That paper reports spatial block cross-validation agreement with MapBiomas, and temporal coherence checks against landowner crop calendars on three properties in western Paraná.
NOTEFigures as reported in the paper. MapBiomas is a reference map, not field truth.
05Flight rules
Where the current models stop
These are limits of the models TERRA ships today, not of the application. Improving the models is the subject of ongoing research; a better model reaches TERRA once it has been validated and published.
- MD-01
The output legend is fixed.
The current crop models emit classes 3, 21, 25, 39 and 41 and nothing else. They cannot predict pasture, savanna or any other MapBiomas code. An area in another biome can return a confident and semantically wrong result, which is why domain-shift diagnosis exists.
- MD-02
The models were fitted for western Paraná.
The current classifiers learned from study areas in western Paraná, Brazil. The training data are not distributed with the application.
In researchDomain-shift diagnosis ships today and says how far an area sits from that ground. Adapting the models to it remains research.
- MD-03
Class 41 is a residual bucket.
High overall accuracy against MapBiomas does not imply fine crop identity.
In researchDecomposing class 41 into crops that can be named is in research.
06Ground segment
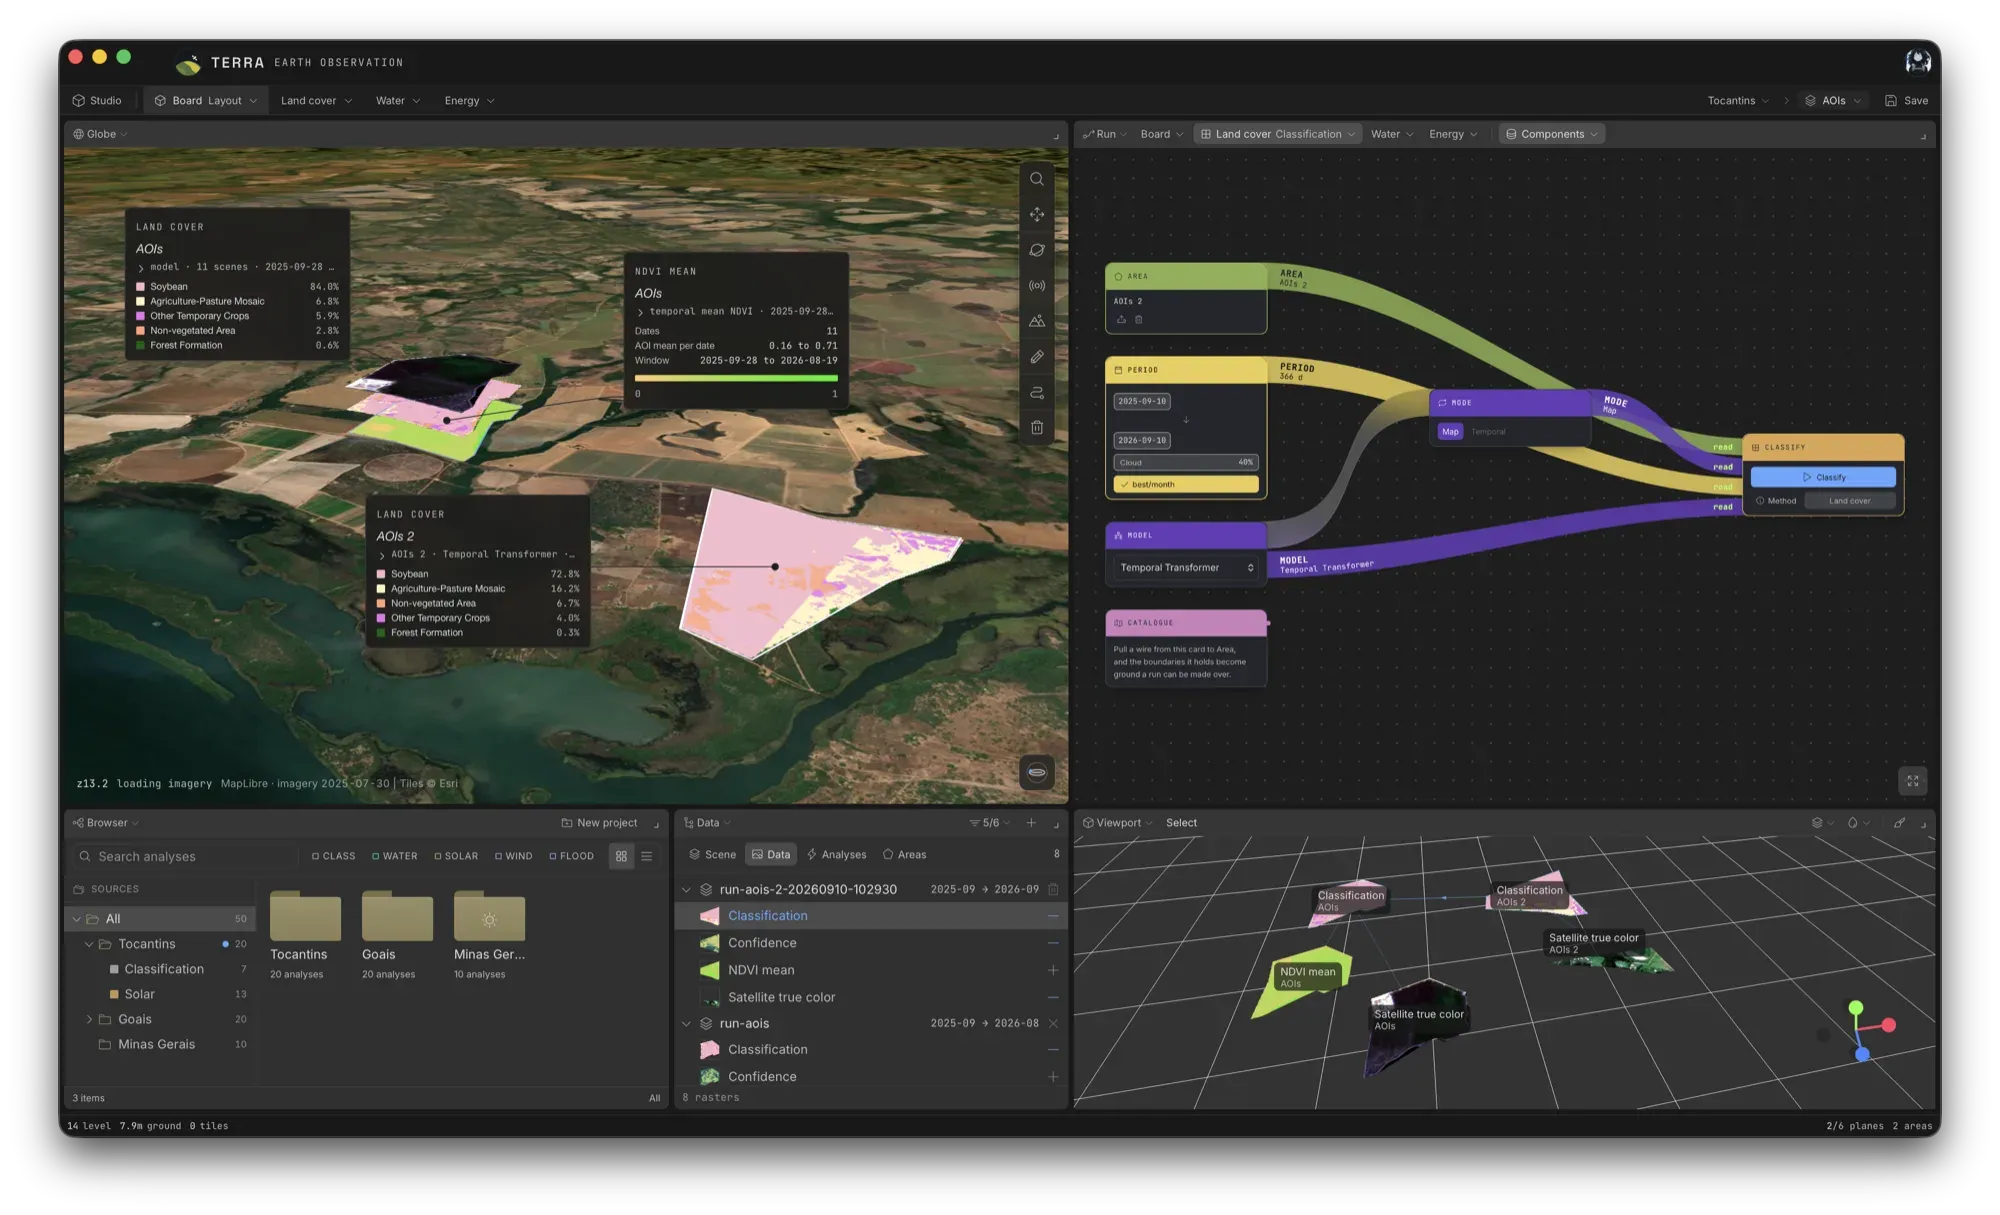
The studio
A map puts things where they are, so two areas hundreds of kilometres apart cannot sit side by side on one. The studio exists for that.
07Mission log
Recent releases
- v0.7.0SunsetFields and minerals join the area, the board gains a compositor, and a project becomes a file.03 Oct 2026
- v0.6.0CumulusWater that moves, the grid a plant would join, and the run laid out as a graph of cards.10 Sep 2026
- v0.5.0DraugenThe flood envelope, and one planet for both the map and the studio.31 Aug 2026

Also from TERRAIn development
A closed product of the TERRA family, in development for the energy market.
v0.7.0Sunset · released 03 Oct 2026
Take TERRA to your own ground
Free and open source under GPL-3.0. For macOS, Windows and Linux.