- Home
- Products
PLPayload
Products
Nine products computed over the same area of interest. Land cover comes first, with the tools that compare, diagnose and export it; the others read the same ground with their own sources.
- LC-01
Land cover
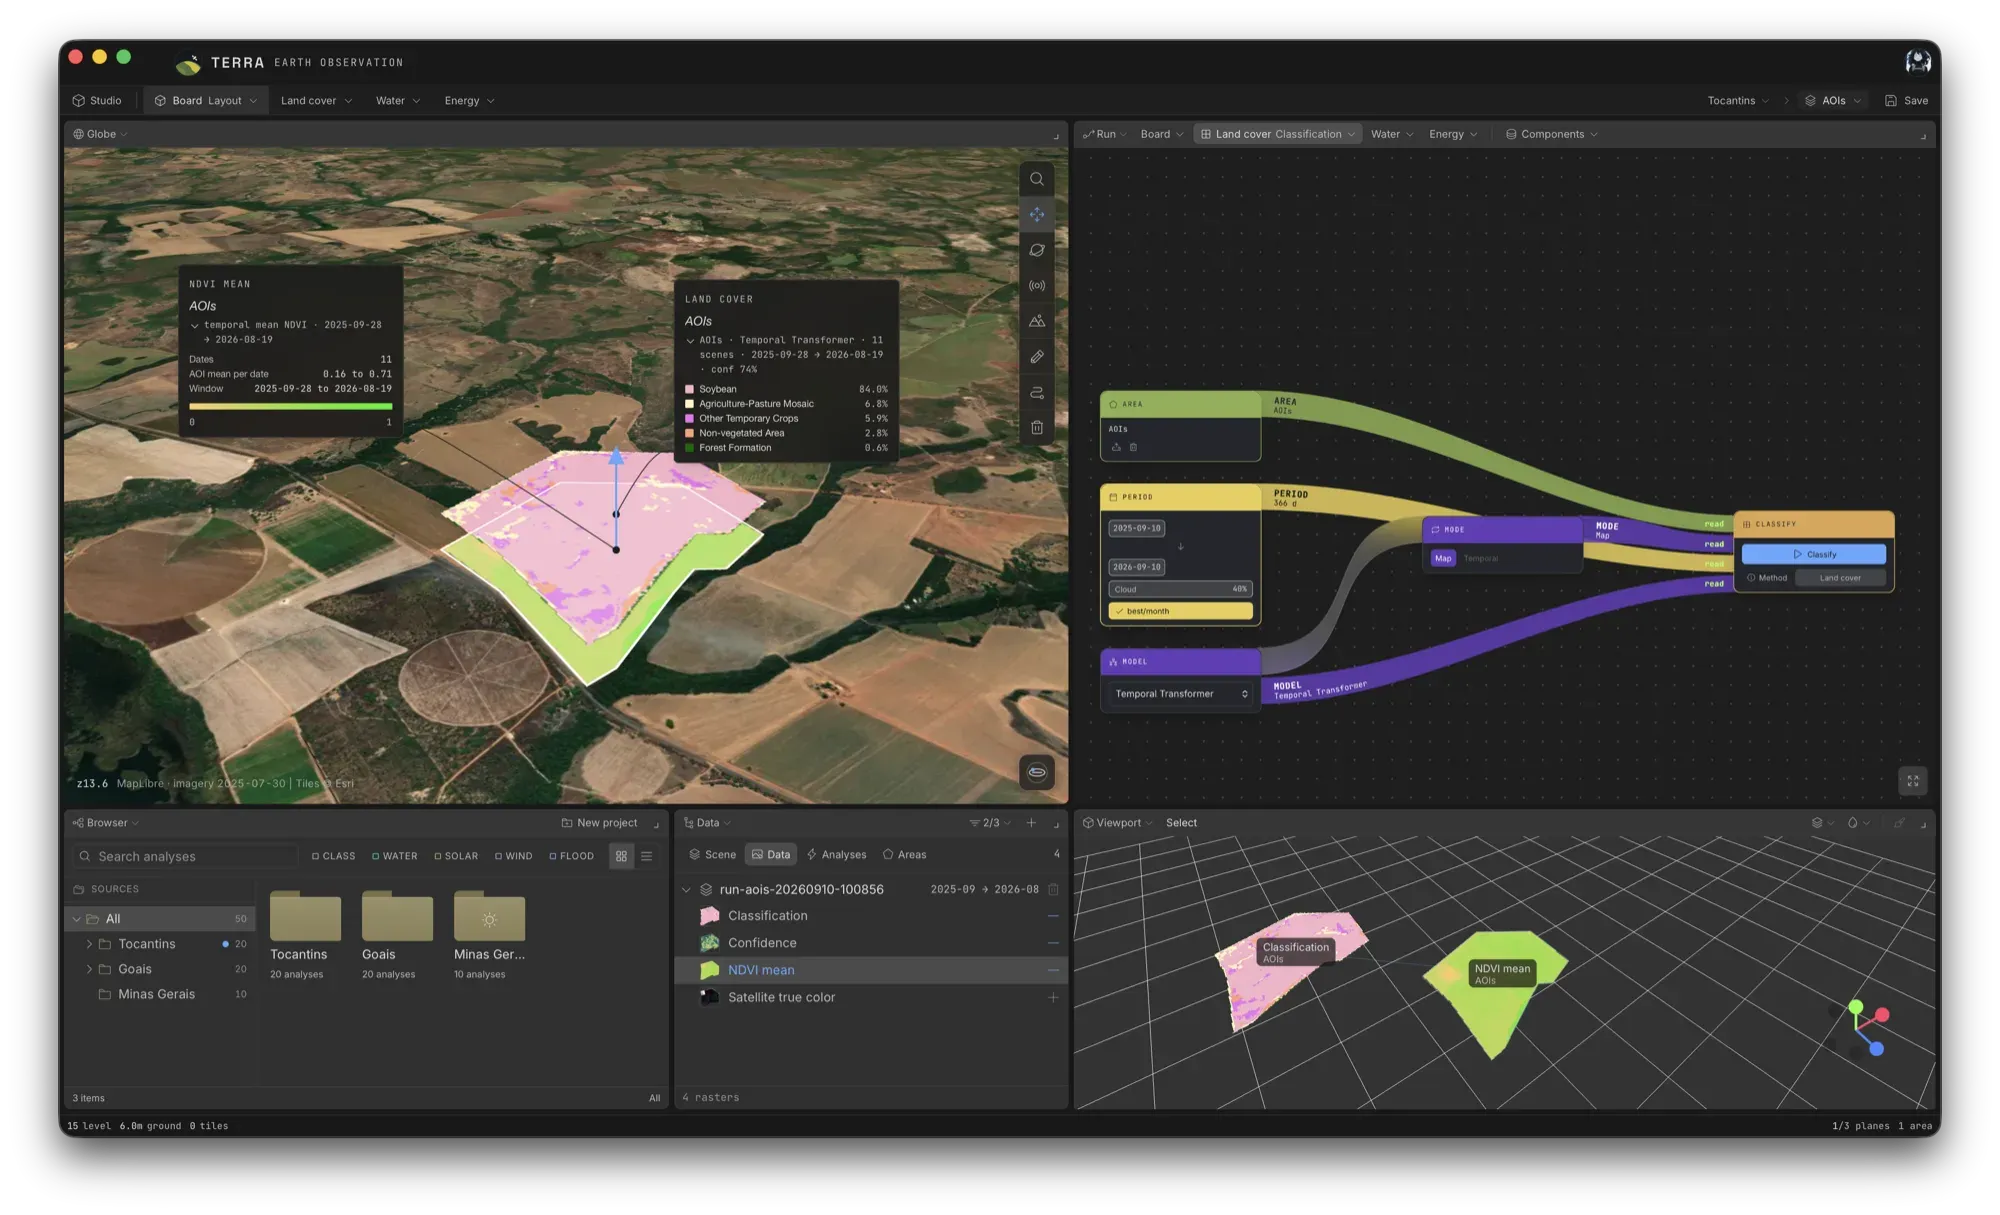
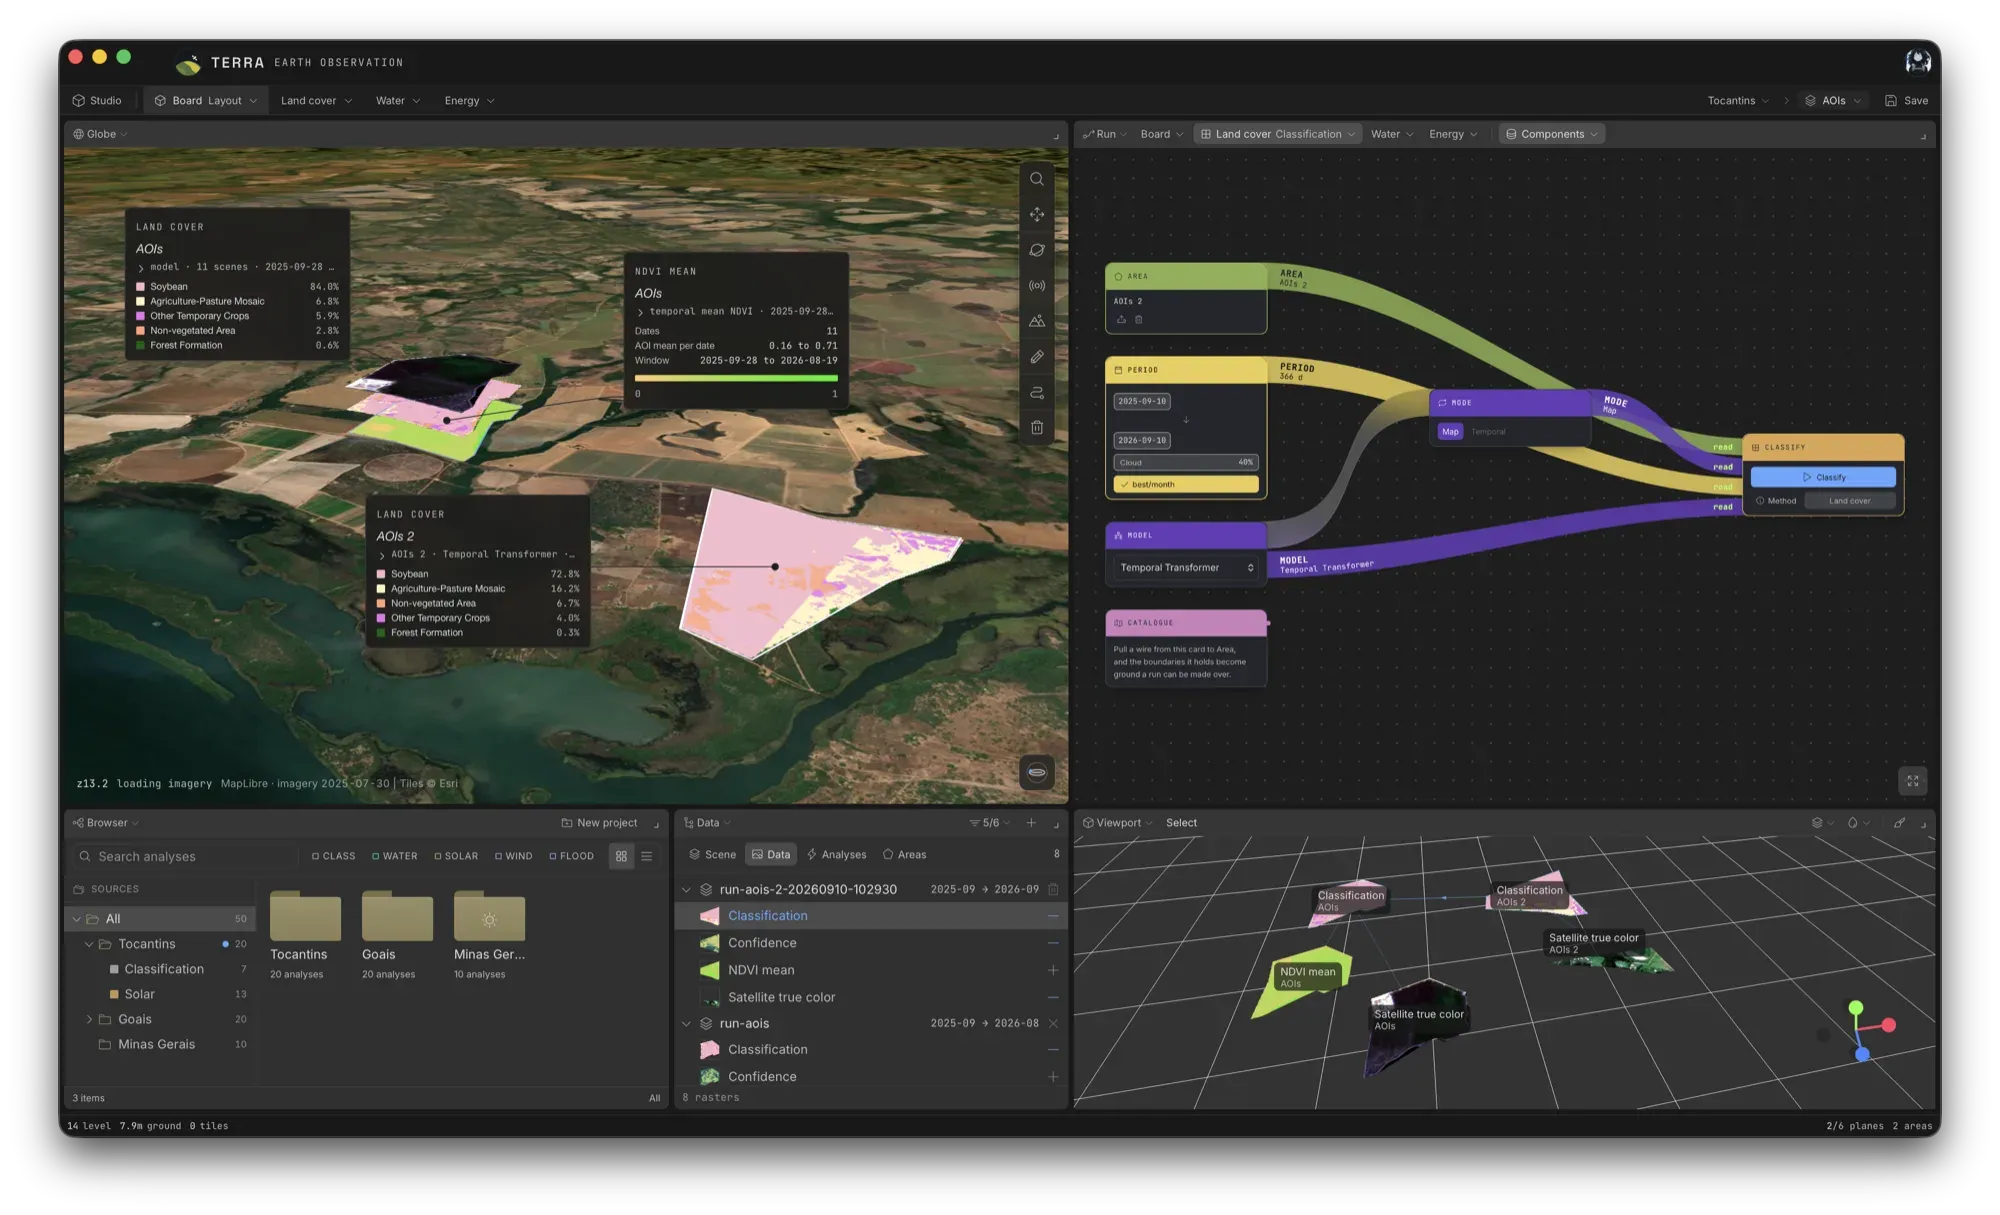
Five MapBiomas classes from a season of Sentinel-2 scenes, with a confidence value for every pixel.
- Sensor
- Sentinel-2 MSI · Level-2A
- Bands
- B02 B03 B04 · B8A B11 B12
- Classes
- 3 · 21 · 25 · 39 · 41
- CM-02
Compare
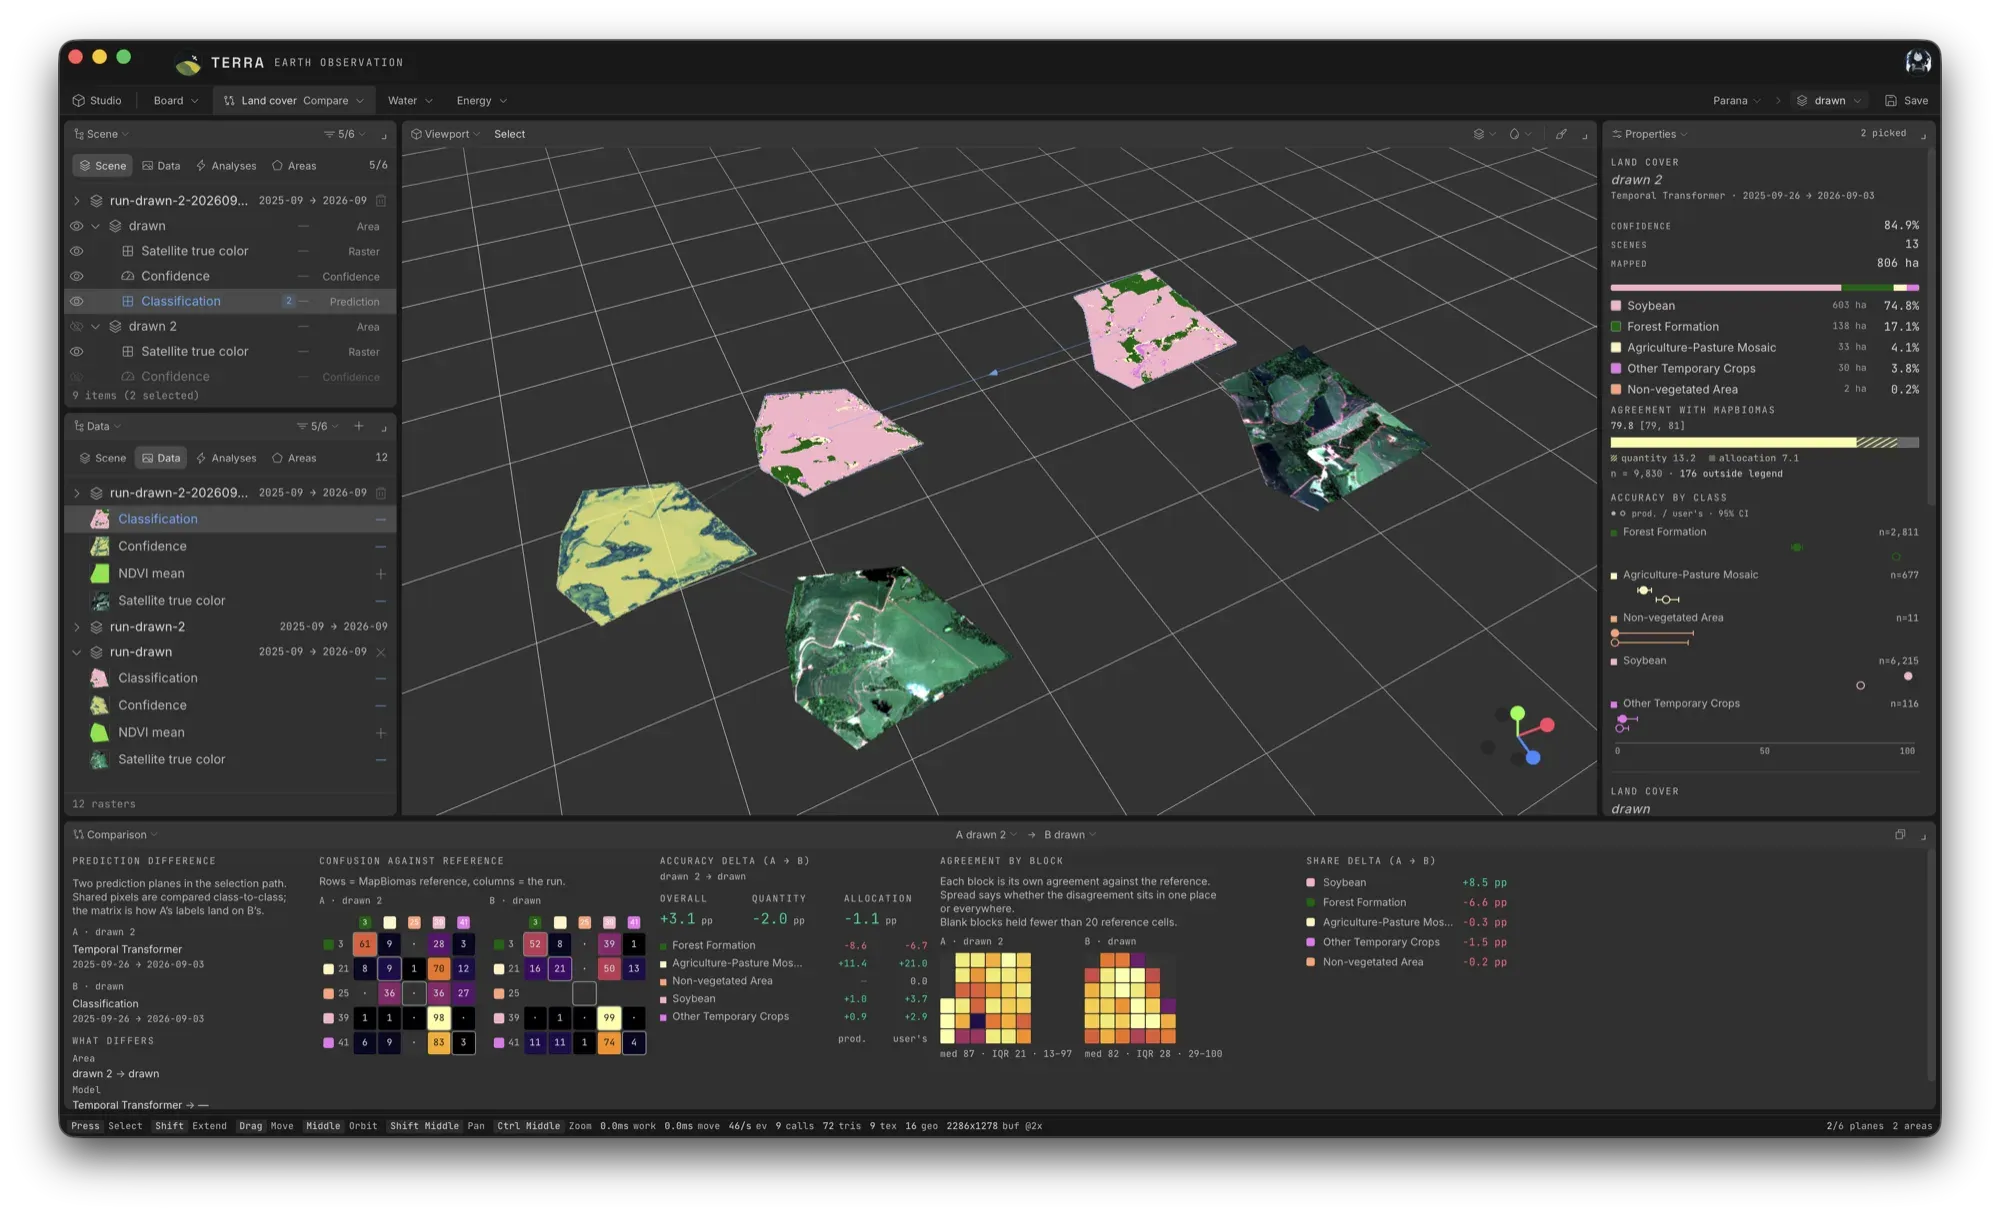
How the models perform across areas of interest in different regions, whether in the same state or in different ones.
- Compares
- Two runs: areas in the same region or in different states
- Reference
- MapBiomas Collection 10 · 2023
- Per class
- Producer's and user's accuracy, 95% Wilson intervals
- DG-03
Diagnose
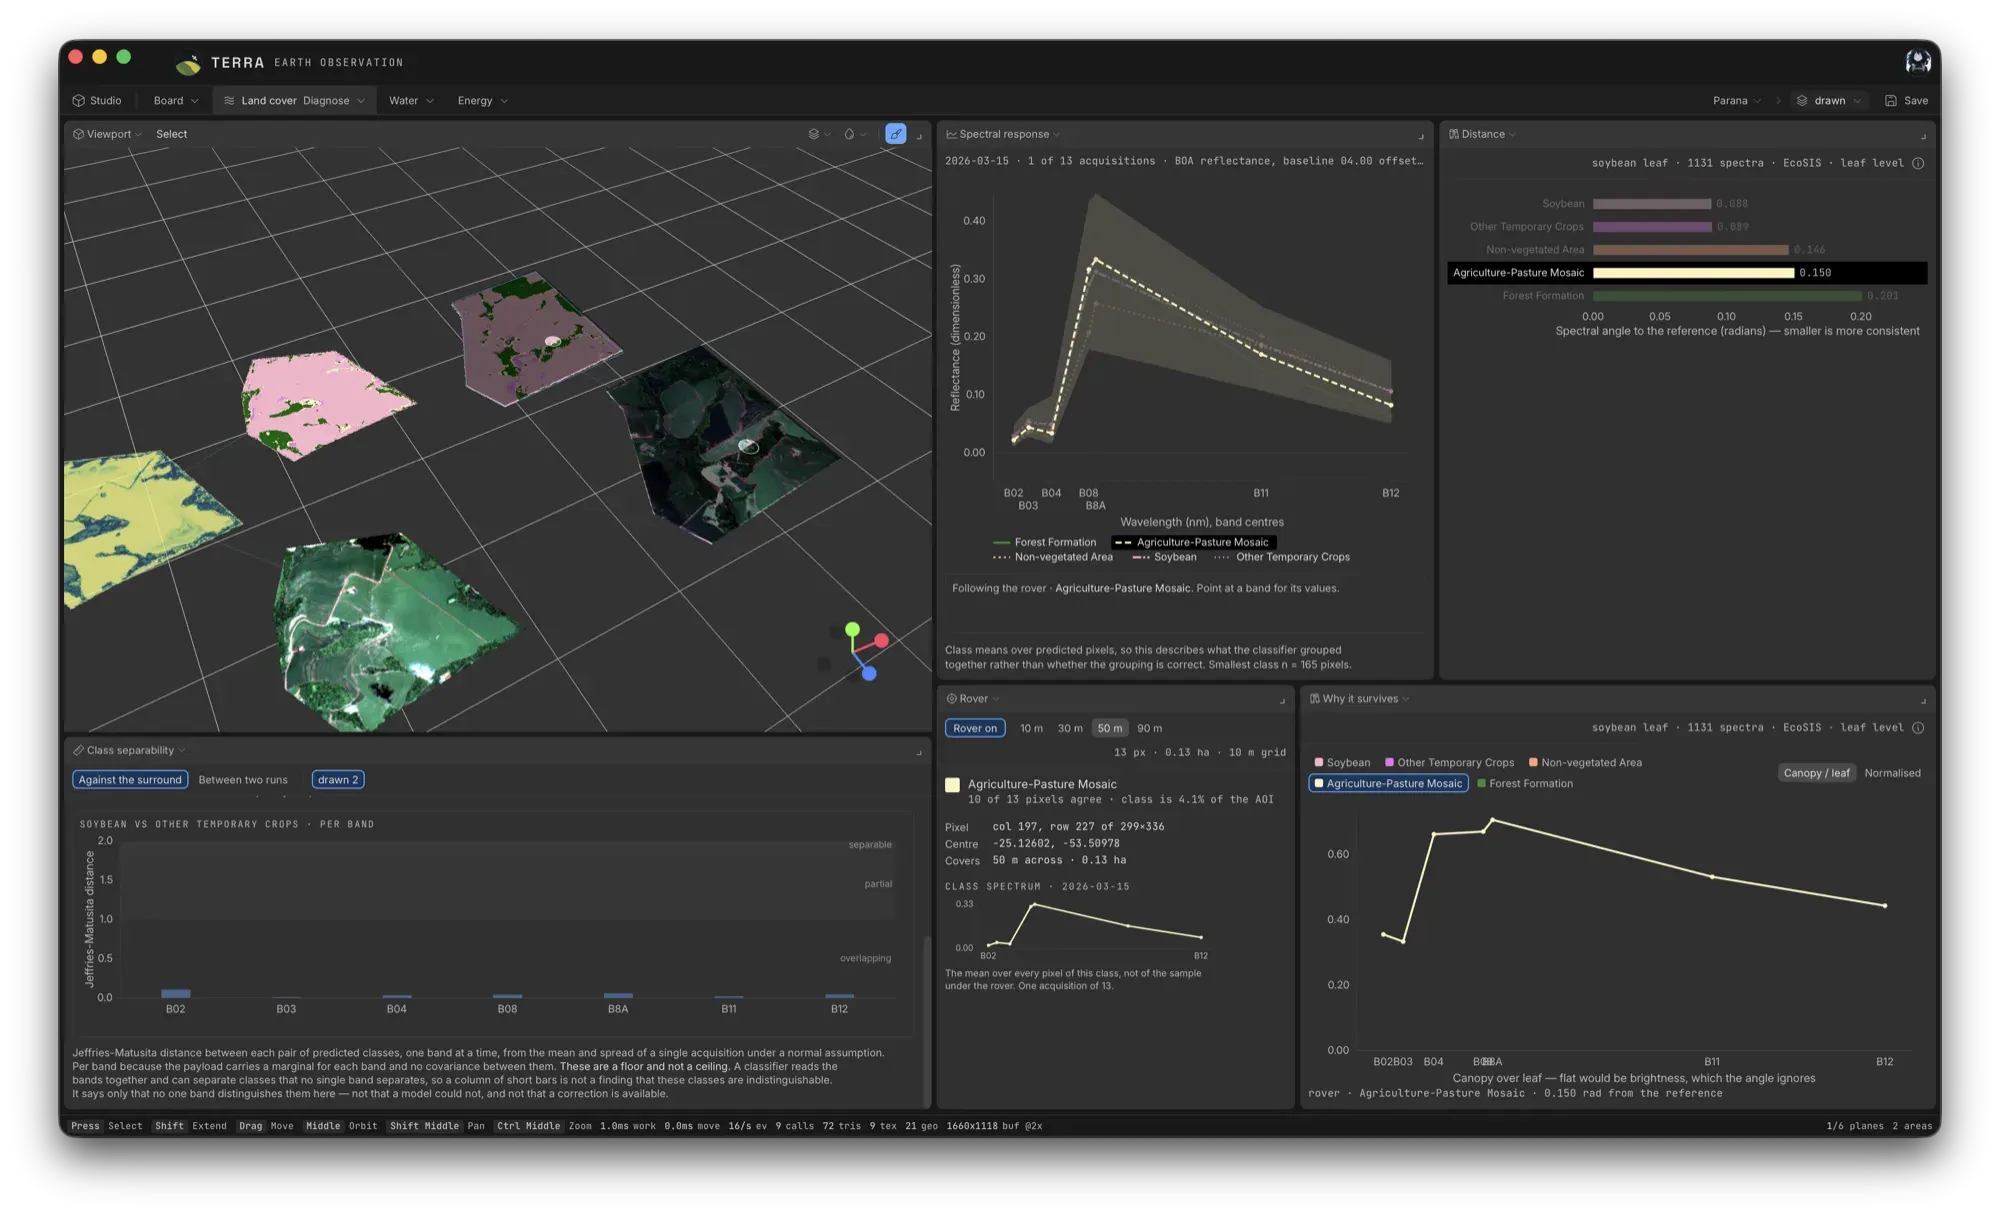
Domain shift between areas, and a detailed analysis of the spectral response of each predicted class.
- Domain shift
- Symmetric KL · CVA · RBF MMD · per-feature table
- Spectral response
- Mean reflectance of each class, band by band
- Library check
- Spectral angle to a leaf-level spectral library
- DT-04
Data and research pack
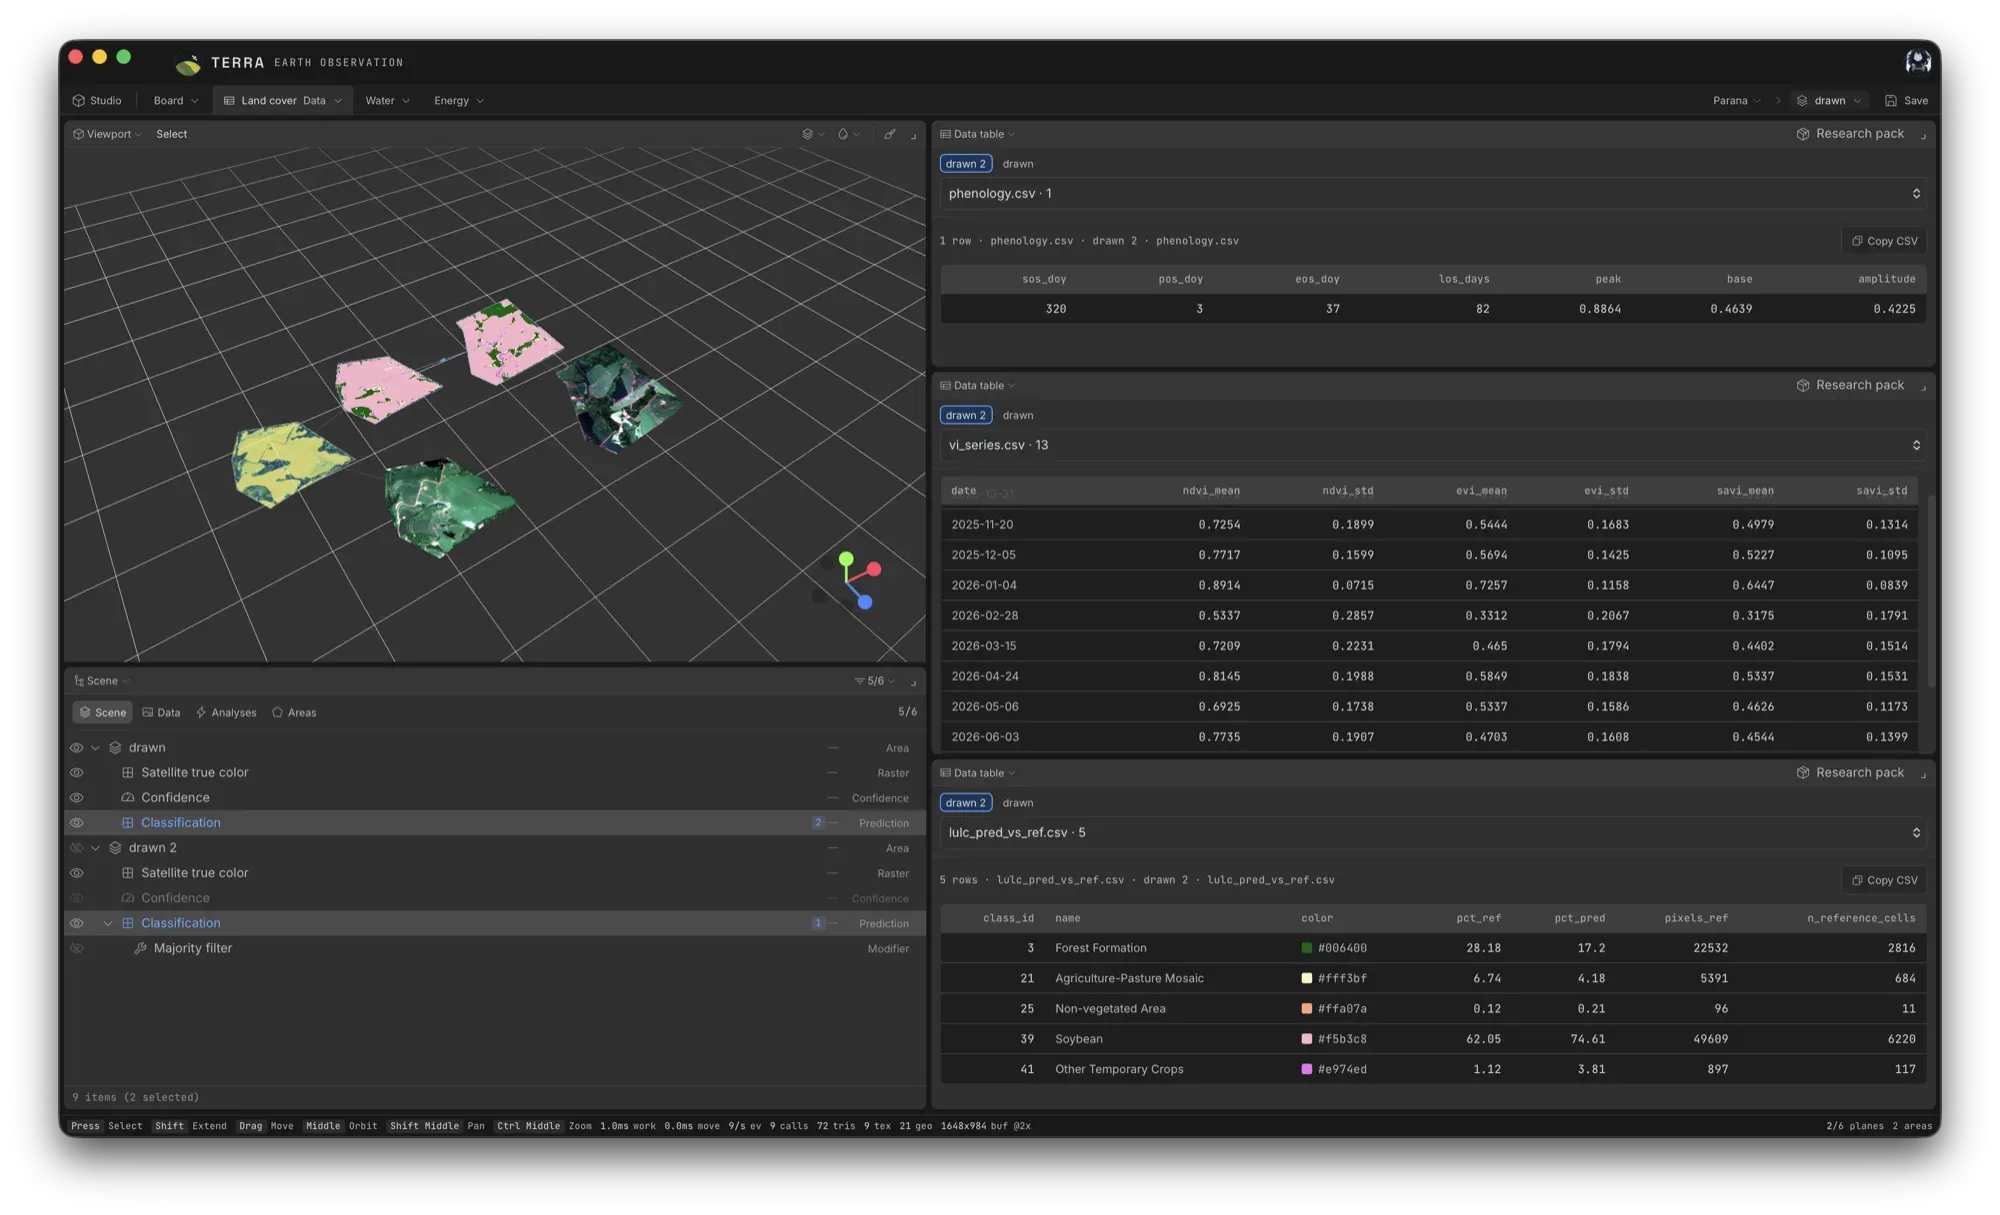
The run's tables (phenology, vegetation-index series, prediction against the reference), read in the studio and exported as a research pack.
- Tables
- phenology · vi_series · lulc_pred_vs_ref
- Series
- NDVI, EVI and SAVI mean and spread, date by date
- Phenology
- Start, peak and end of season, length, amplitude
- CP-05
Band compositions
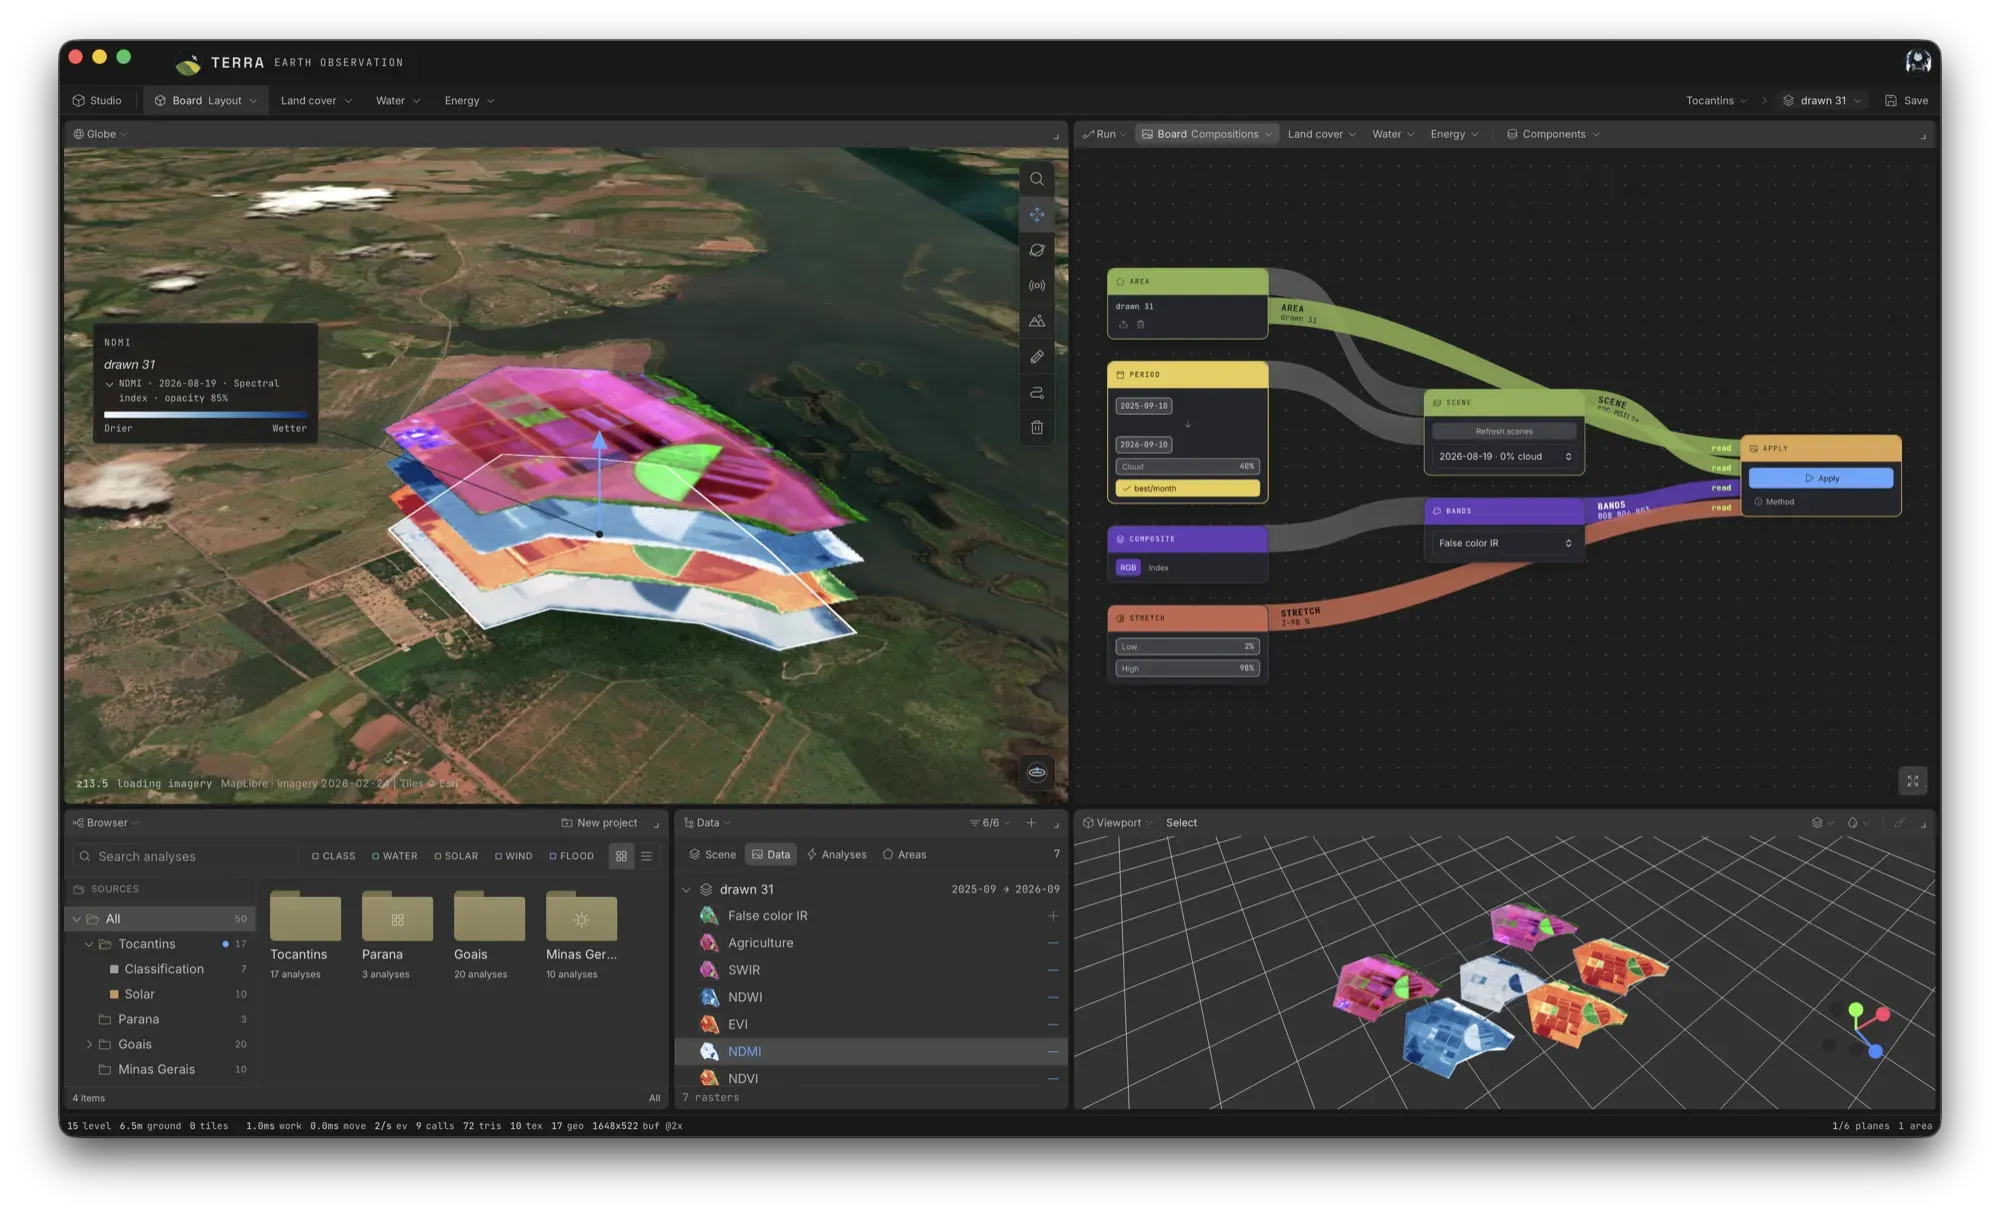
True colour, false-colour infrared, agriculture and SWIR composites, or a spectral index, from any scene in the window.
- Presets
- True colour · False colour IR · Agriculture · SWIR
- Indices
- NDVI · EVI · NDWI · NDMI
- Custom
- Any three bands to R, G, B
- WR-06
Water routing
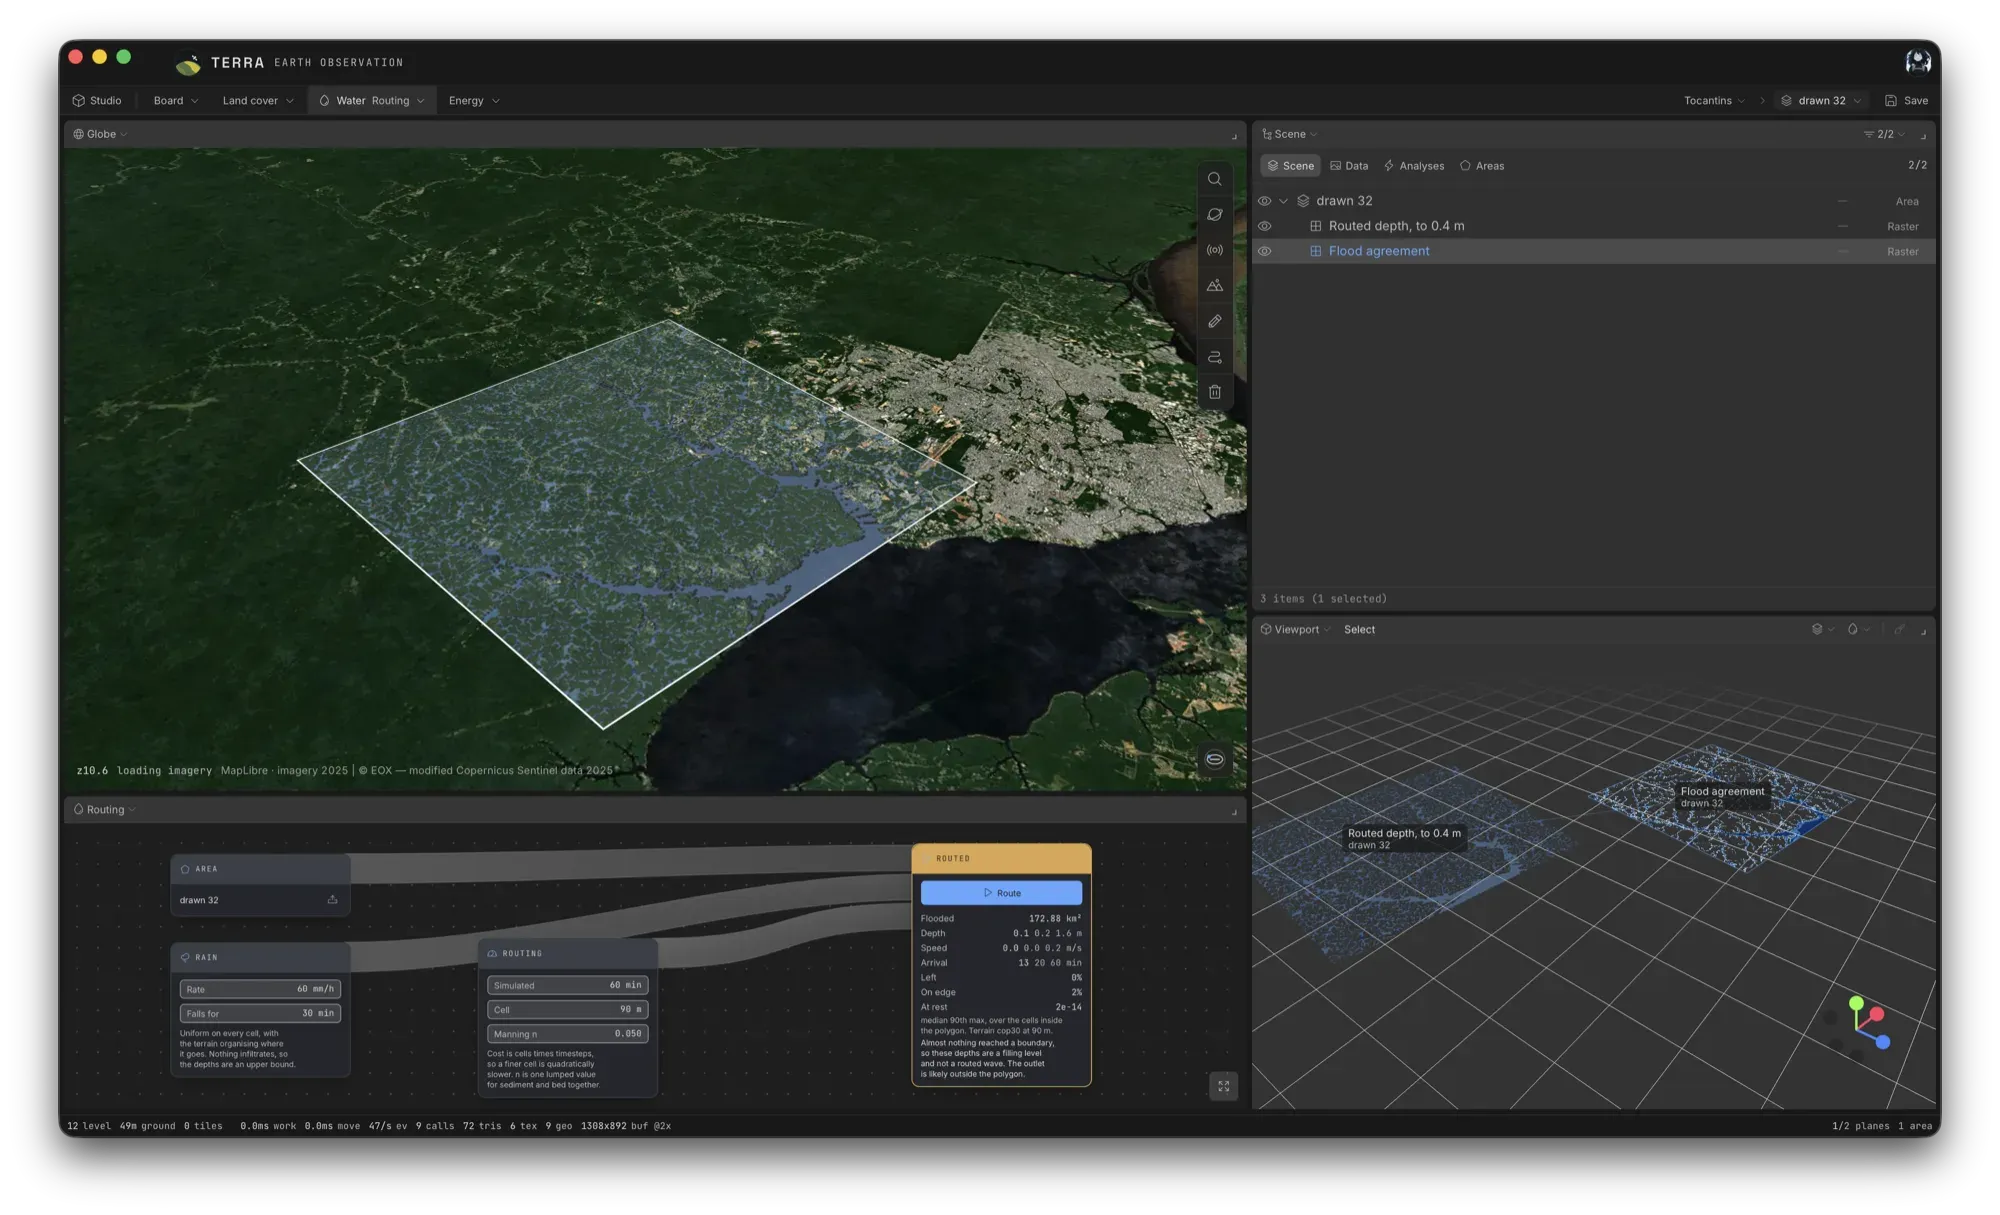
Rain put on every cell and routed over the terrain: where it goes, how deep, how fast and when it arrives.
- Question
- Where rain goes, how deep, and when
- Rain
- A rate and a duration, uniform on every cell
- Terrain
- Copernicus DEM GLO-30, depressions filled
- FL-07
Flood envelope
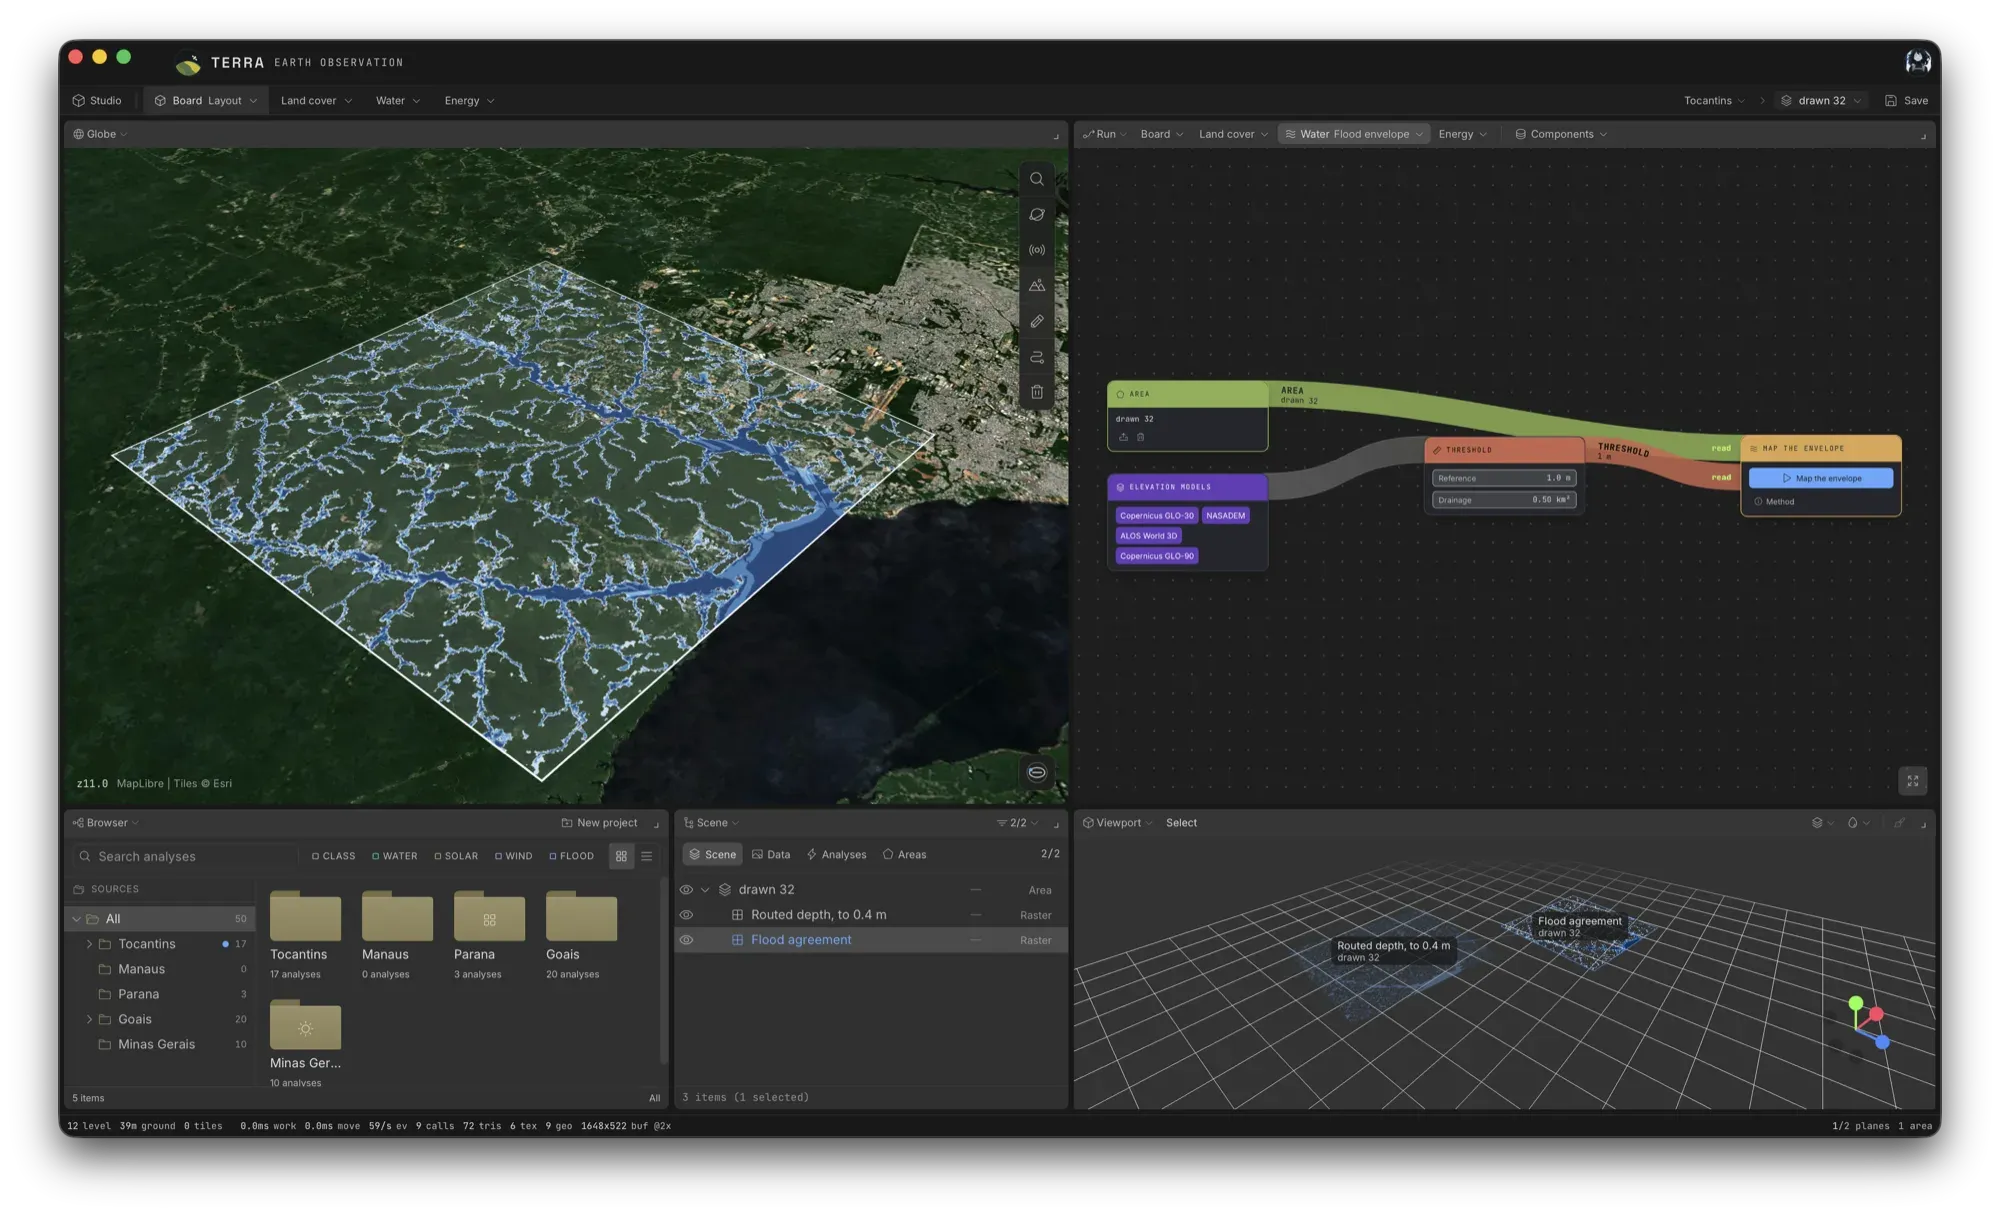
Height above the nearest drainage, measured on four elevation models, with the agreement between them drawn on the map.
- Method
- HAND: height above nearest drainage
- Elevation models
- Copernicus GLO-30 · NASADEM · ALOS World 3D · Copernicus GLO-90
- Reference threshold
- 1 m above drainage
- CS-08
Canopy simulation
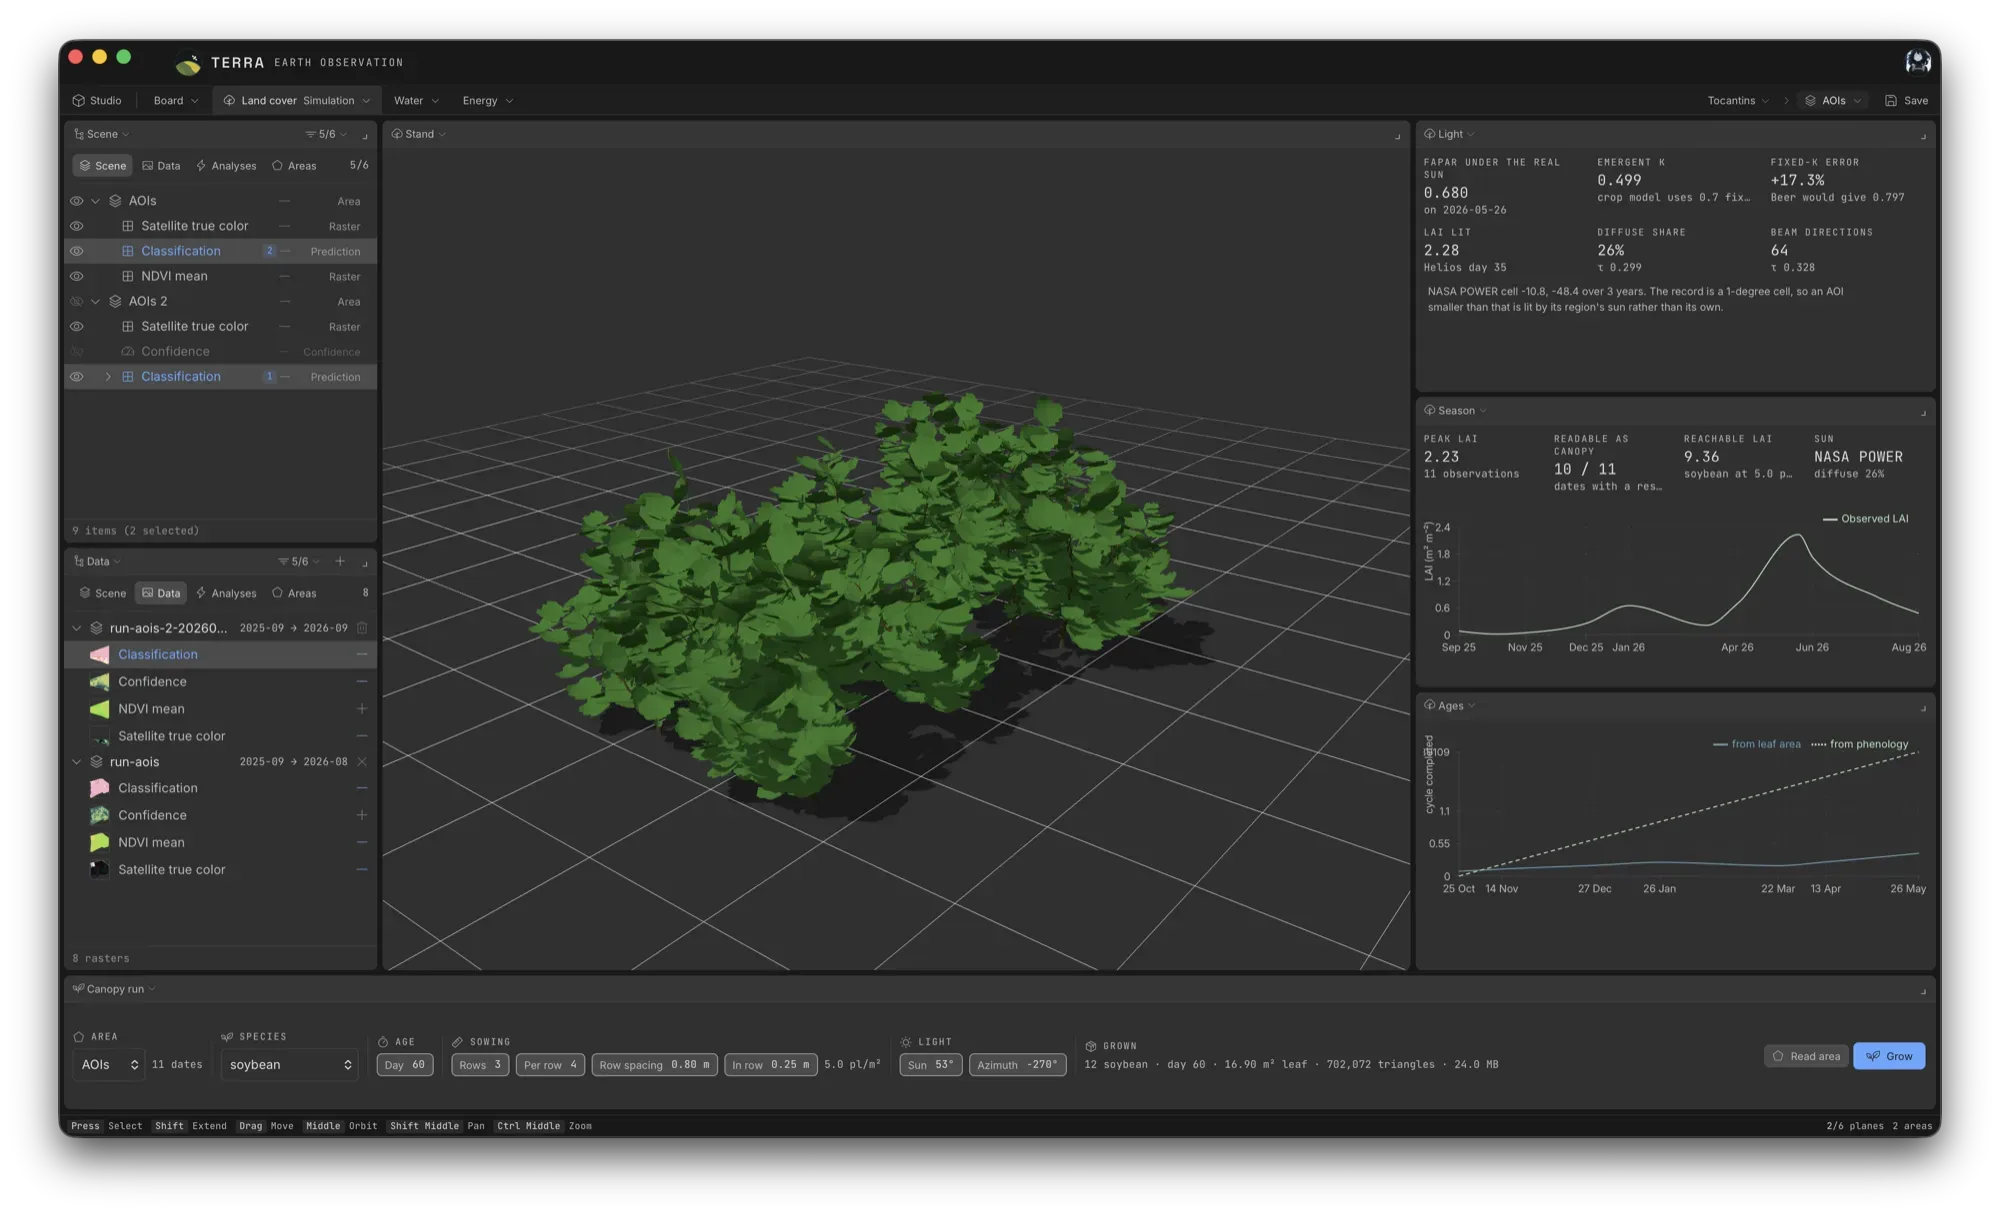
A crop stand grown from what the satellite measured and lit by its own sky. The reading at the end is the fraction of light it intercepts.
- Input
- NDVI series of the classified crop
- Leaf area
- Beer–Lambert inversion (Baret & Guyot 1991)
- Species
- 24 with known growth curves
- EN-09Secondary
Solar and wind
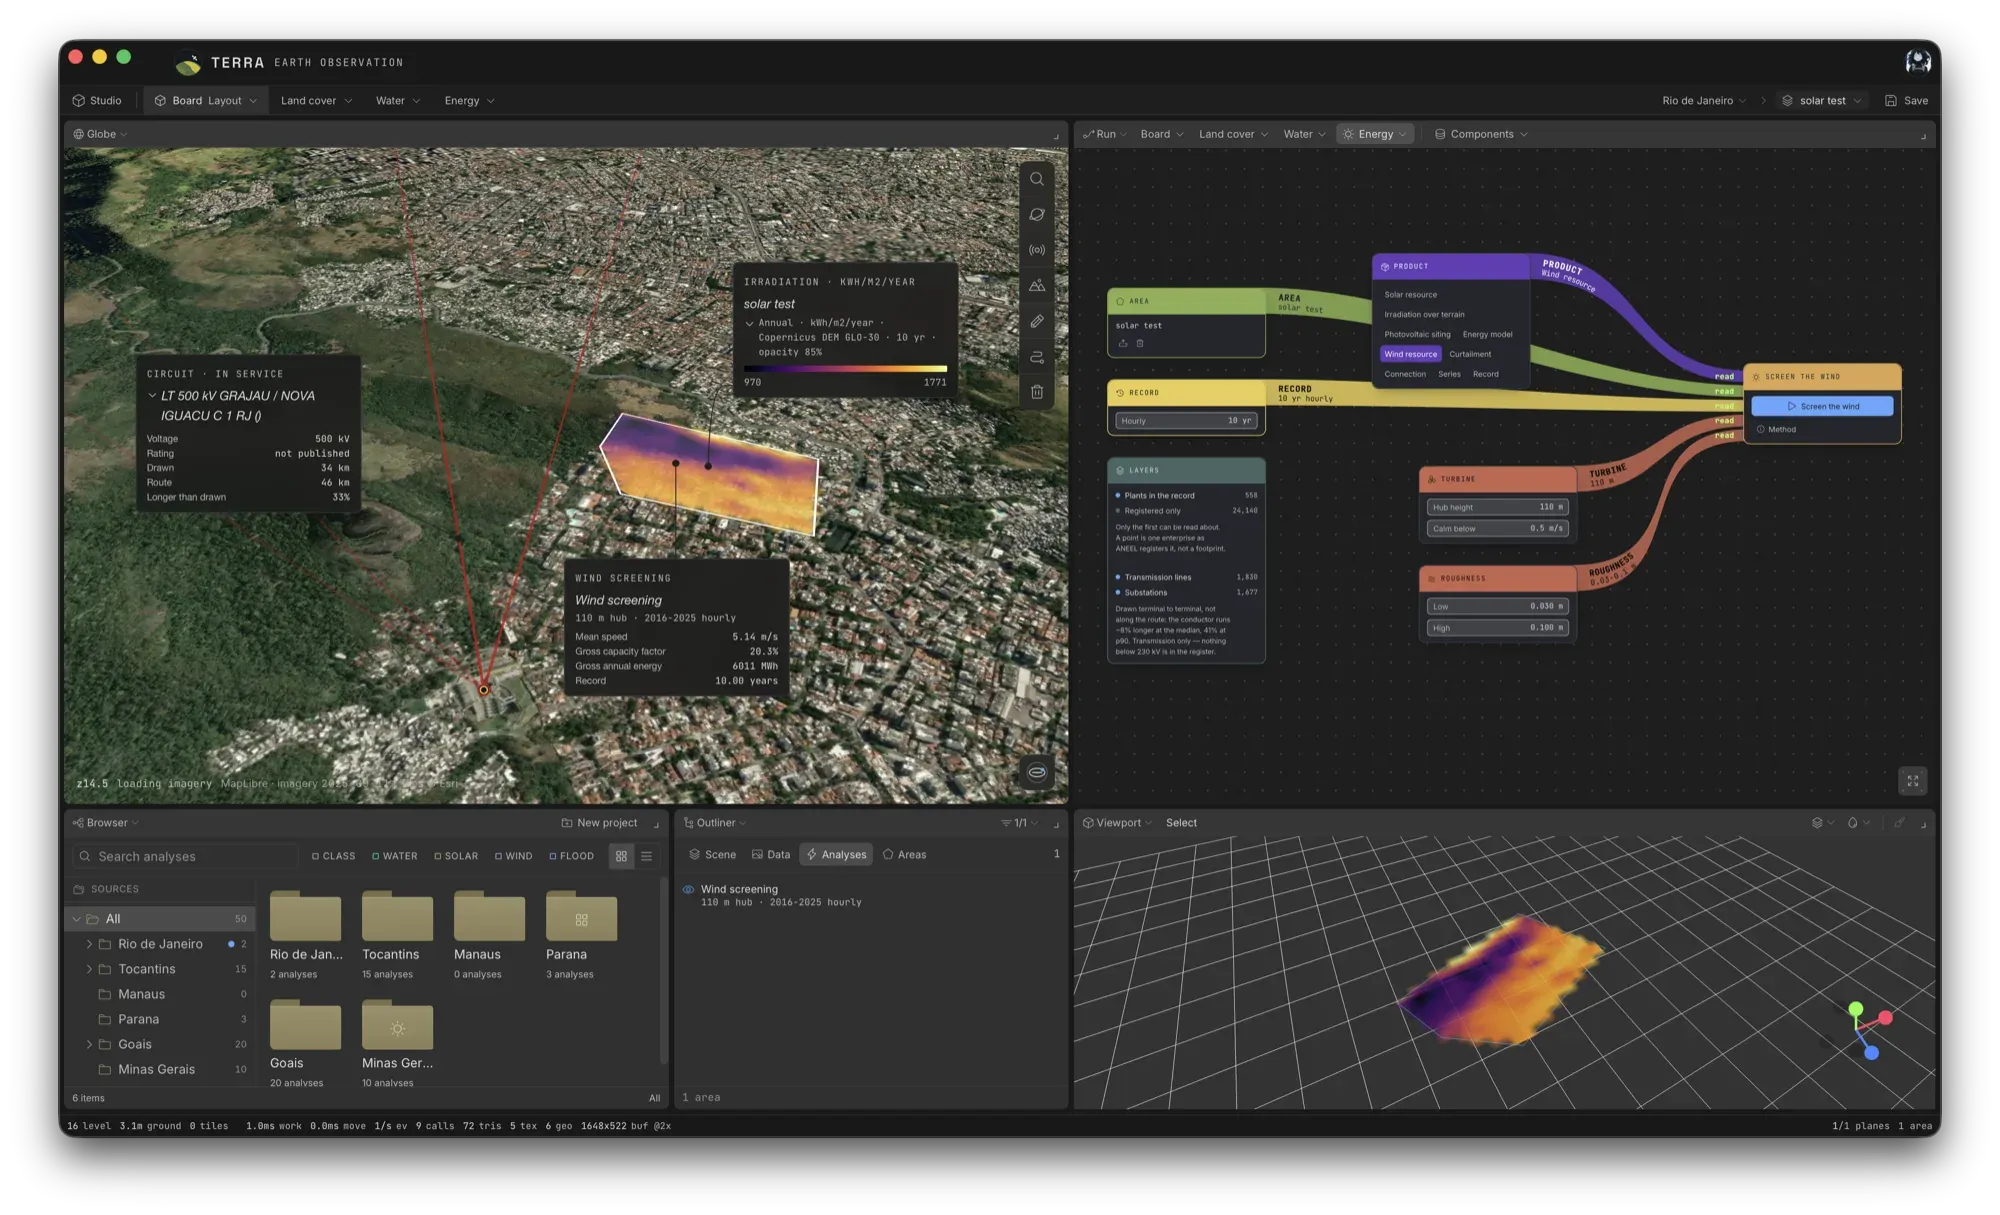
Solar resource, PV siting and yield, wind screening, and what the electrical grid does to a plant. A screening step, not a siting study.
- Irradiation
- NASA POWER hourly record · 1° cell
- Terrain
- Copernicus DEM GLO-30 · slope, aspect, horizon
- Siting
- Slope limits and existing land cover